Use Histogram to examine the shape and spread of your data. A histogram divides sample values into many intervals and represents the frequency of data values in each interval with a bar. A histogram works best when the sample size is at least 20. However, a sample size that is considerably greater than 20 may better represent the distribution.
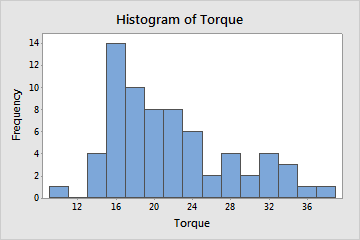
For example, a quality engineer creates a histogram to examine the distribution of the amount of torque that is required to remove the caps from a sample of shampoo bottles.
Where to find this graph
To create a histogram, choose .
When to use an alternate graph
If the sample size is less than 20, consider using an Individual value plot instead.