A bank requires eight pieces of information from loan applicants: income, education level, age, length of time at current residence, length of time with current employer, savings, debt, and number of credit cards. A bank administrator wants to analyze this data to determine the best way to group and report it. The administrator collects this information for 30 loan applicants.
The bank administrator uses the Pearson correlation to examine the strength and direction of the linear relationship between each pair of variables.
- Open the sample data, LoanApplicant.MWX.
- Choose .
- In Variables, enter Income-Credit cards.
- Select Display correlation values.
- Click OK.
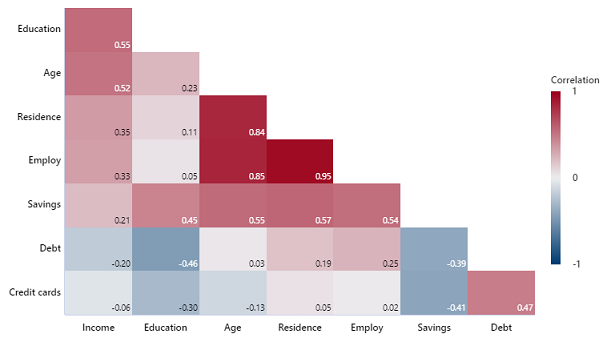
Interpret the results
The highest Pearson correlation coefficient is between Employ and Residence. This value of 0.95 represents a positive relationship between the variables. As employment increases, residence also increases. Age also has a strong positive relationship with Residence and Employ.
The Pearson correlation coefficient between Debt and Education is –0.46. As an applicant's education level decreases, the debt increases.
Overall, most pairs of variables have a positive correlation.