In Graph variables, enter one or more numeric or date/time columns that you want to graph. By default, Minitab creates a separate graph for each variable.
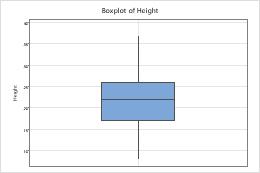
In this worksheet, Height is the graph variable. The graph shows the distribution of heights.
You are now leaving support.minitab.com.
Click Continue to proceed to: