In This Topic
Step 1: Determine whether an outlier exists
- P-value ≤ α: An outlier exists (Reject H0)
- If the p-value is less than or equal to the significance level, the decision is to reject the null hypothesis and conclude that an outlier exists. Try to identify the cause of any outliers. Correct any data–entry errors or measurement errors. Consider removing data values that are associated with abnormal, one-time events (special causes).
- P-value > α: You cannot conclude an outlier exists (Fail to reject H0)
- If the p-value is greater than the significance level, the decision is to fail to reject the null hypothesis because you do not have enough evidence to conclude that an outlier exists. You should make sure that your test has enough power to detect an outlier. For more information, go to Increase power.
Method
| Null hypothesis | All data values come from the same normal population |
|---|---|
| Alternative hypothesis | Smallest data value is an outlier |
| Significance level | α = 0.05 |
Grubbs' Test
| Variable | N | Mean | StDev | Min | Max | G | P |
|---|---|---|---|---|---|---|---|
| BreakStrength | 14 | 123.4 | 46.3 | 12.4 | 193.1 | 2.40 | 0.044 |
Outlier
| Variable | Row | Outlier |
|---|---|---|
| BreakStrength | 10 | 12.38 |
Key Result: P
In these results, the null hypothesis states that all data values come from the same normal population. Because the p-value is 0.044, which is less than the significance level of 0.05, the decision is to reject the null hypothesis and conclude that an outlier exists.
Step 2: Determine the value of the outlier
If the test identifies an outlier in the data, then Minitab displays an outlier table. Use the outlier table to determine the value of the outlier, and the row in the worksheet that contains the outlier.
Method
| Null hypothesis | All data values come from the same normal population |
|---|---|
| Alternative hypothesis | Smallest data value is an outlier |
| Significance level | α = 0.05 |
Grubbs' Test
| Variable | N | Mean | StDev | Min | Max | G | P |
|---|---|---|---|---|---|---|---|
| BreakStrength | 14 | 123.4 | 46.3 | 12.4 | 193.1 | 2.40 | 0.044 |
Outlier
| Variable | Row | Outlier |
|---|---|---|
| BreakStrength | 10 | 12.38 |
Key Results: Row, Outlier
In these results, the value of the outlier is 12.38, and it is in row 10.
Step 3: Visually identify the outlier
Use the outlier plot to visually identify an outlier in the data. If an outlier exists, Minitab represents it on the plot as a red square. Try to identify the cause of any outliers. Correct any data–entry errors or measurement errors. Consider removing data values for abnormal, one-time events (also called special causes).
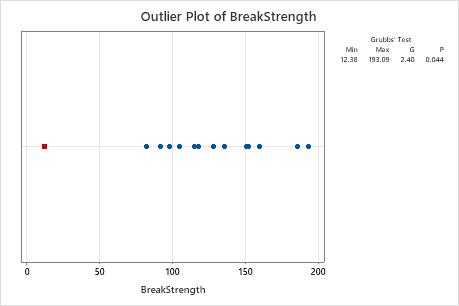
In this outlier plot, the smallest value, 12.38, is an outlier.