The slope indicates the steepness of a line and the intercept indicates the location where it intersects an axis. The slope and the intercept define the linear relationship between two variables, and can be used to estimate an average rate of change. The greater the magnitude of the slope, the steeper the line and the greater the rate of change.
By examining the equation of a line, you quickly can discern its slope and y-intercept (where the line crosses the y-axis).
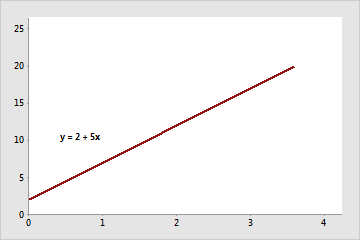
The slope is positive 5. When x increases by 1, y increases by 5. The y-intercept is 2.
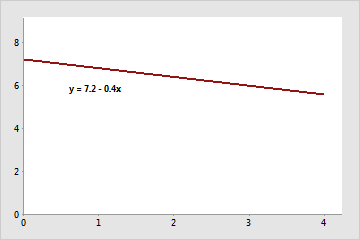
The slope is negative 0.4. When x increases by 1, y decreases by 0.4. The y-intercept is 7.2.
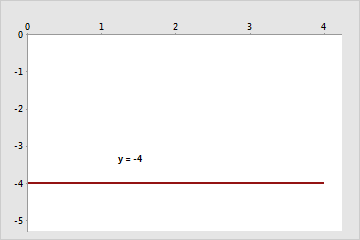
The slope is 0. When x increases by 1, y neither increases or decreases. The y-intercept is -4.
Usually, this relationship can be represented by the equation y = b0 + b1x, where b0 is the y-intercept and b1 is the slope.
For example, a company determines that job performance for employees in a production department can be predicted using the regression model y = 130 + 4.3x, where x is the hours of in-house training they receive (from 0 to 20) and y is their score on a job skills test. The value of the y-intercept (130) indicates the average job skill score for an employee with no training. The value of the slope (4.3) indicates that for each hour of training, the job skill score increases, on average, by 4.3 points.