In This Topic
N
The sample size (N) is the total number of observations in each group.
Interpretation
The sample size affects the confidence interval and the power of the test.
Usually, a larger sample yields a narrower confidence interval. A larger sample size also gives the test more power to detect a difference.
Mean
The mean of the observations within each group. The mean describes each group with a single value identifying the center of the data. It is the sum of all the observations with a group divided by the number of observations in that group.
Interpretation
The mean of each sample provides an estimate of each population mean. The differences between sample means are the estimates of the difference between the population means.
Because the difference between the group means are based on data from a sample and not the entire population, you cannot be certain it equals the population difference. To get a better sense of the population difference, you can use the confidence interval.
Grouping
Use the Grouping Information table to quickly determine whether the mean difference between any pair of groups is statistically significant.
The Grouping column contains letters that group the factor levels. Groups that do not share a letter have a mean difference that is statistically significant.
If the table identifies differences that are statistically significant, use the confidence intervals of the differences to determine whether the differences are practically significant.
Interpretation
Grouping Information Using the Tukey Method and 95% Confidence
| Paint | N | Mean | Grouping | |
|---|---|---|---|---|
| Blend 4 | 6 | 18.07 | A | |
| Blend 1 | 6 | 14.73 | A | B |
| Blend 3 | 6 | 12.98 | A | B |
| Blend 2 | 6 | 8.57 | B | |
In these results, the table shows that group A contains Blends 1, 3, and 4, and group B contains Blends 1, 2, and 3. Blends 1 and 3 are in both groups. Differences between means that share a letter are not statistically significant. Blends 2 and 4 do not share a letter, which indicates that Blend 4 has a significantly higher mean than Blend 2.
Fisher Individual Tests for Differences of Means
Use the individual confidence intervals to identify statistically significant differences between the group means, to determine likely ranges for the differences, and to determine whether the differences are practically significant. Fisher's individual tests table displays a set of confidence intervals for the difference between pairs of means.
The individual confidence level is the percentage of times that a single confidence interval includes the true difference between one pair of group means, if you repeat the study. Individual confidence intervals are available only for Fisher's method. All of the other comparison methods produce simultaneous confidence intervals.
Controlling the individual confidence level is uncommon because it does not control the simultaneous confidence level, which often increases to unacceptable levels. If you do not control the simultaneous confidence level, the chance that at least one confidence interval does not contain the true difference increases with the number of comparisons.
The confidence interval of the difference is composed of the following two parts:
- Point estimate
- The point estimate is the difference between a pair of means and is calculated from the sample data. The confidence interval is centered on this value.
- Margin of error
- The margin of error defines the width of the confidence interval and is determined by the observed variability in the sample and the confidence level. To calculate the upper limit of the confidence interval, the margin of error is added to the point estimate. To calculate the lower limit of the confidence interval, the margin of error is subtracted from the point estimate.
Interpretation
Use the confidence intervals to assess the differences between group means.
Fisher Individual Tests for Differences of Means
| Difference of Levels | Difference of Means | SE of Difference | 95% CI | T-Value | Adjusted P-Value |
|---|---|---|---|---|---|
| Blend 2 - Blend 1 | -6.17 | 2.28 | (-10.92, -1.41) | -2.70 | 0.014 |
| Blend 3 - Blend 1 | -1.75 | 2.28 | (-6.51, 3.01) | -0.77 | 0.452 |
| Blend 4 - Blend 1 | 3.33 | 2.28 | (-1.42, 8.09) | 1.46 | 0.159 |
| Blend 3 - Blend 2 | 4.42 | 2.28 | (-0.34, 9.17) | 1.94 | 0.067 |
| Blend 4 - Blend 2 | 9.50 | 2.28 | (4.74, 14.26) | 4.17 | 0.000 |
| Blend 4 - Blend 3 | 5.08 | 2.28 | (0.33, 9.84) | 2.23 | 0.037 |
- The confidence interval for the difference between the means of Blend 4 and 2 extends from 4.74 to 14.26. This range does not include zero, which indicates that the difference between these means is statistically significant.
- The confidence interval for the difference between the means of Blend 2 and 1 extends from -10.92 to -1.41. This range does not include zero, which indicates that the difference between these means is statistically significant.
- The confidence interval for the difference between the means of Blend 4 and 3 extends from 0.33 to 9.84. This range does not include zero, which indicates that the difference between these means is statistically significant.
- The confidence intervals for all the remaining pairs of means include zero, which indicates that the differences are not statistically significant.
- The 95% individual confidence level indicates that you can be 95% confident that each confidence interval contains the true difference for that specific comparison. However, the simultaneous confidence level indicates that you can be only 80.83% confident that all the intervals contain the true differences.
Difference of Means
This value is the difference between the sample means of two groups.
Interpretation
The differences between the sample means of the groups are estimates of the differences between the populations of these groups.
Because each mean difference is based on data from a sample and not from the entire population, you cannot be certain that it equals the population difference. To better understand the differences between population means, use the confidence intervals.
SE of Difference
The standard error of the difference between means (SE of Difference) estimates the variability of the difference between sample means that you would obtain if you took repeated samples from the same populations.
Interpretation
Use the standard error of the difference between means to determine how precisely the differences between the sample means estimate the differences between the population means. A lower standard error value indicates a more precise estimate.
Minitab uses the standard error of the difference to calculate the confidence intervals of the differences between means, which is a range of values that is likely to include the population differences.
95% CI
Use the simultaneous confidence intervals of the difference (95% CI) to identify mean differences that are statistically significant, to determine likely ranges for the differences, and to assess the practical significance of the differences. The table displays a set of confidence intervals for the difference between pairs of means. Confidence intervals that do not contain zero indicate a mean difference that is statistically significant.
The simultaneous confidence level is the percentage of times that a set of confidence intervals includes the true differences for all group comparisons if the study were repeated multiple times.
Controlling the simultaneous confidence level is particularly important when you perform multiple comparisons. If you do not control the simultaneous confidence level, the chance that at least one confidence interval does not contain the true difference increases with the number of comparisons.
The confidence interval of the difference is composed of the following two parts:
- Point estimate
- The point estimate is the difference between a pair of means and is calculated from the sample data. The confidence interval is centered around this value.
- Margin of error
- The margin of error defines the width of the confidence interval and is determined by the observed variability in the sample, the sample size, and the confidence level. To calculate the upper limit of the confidence interval, the margin of error is added to the point estimate. To calculate the lower limit of the confidence interval, the margin of error is subtracted from the point estimate. The margin widens as the number of comparisons increases in order to maintain the simultaneous level of confidence that all intervals contain the true population differences.
Interpretation
Use the confidence intervals to assess the differences between group means.
Tukey Simultaneous Tests for Differences of Means
| Difference of Levels | Difference of Means | SE of Difference | 95% CI | T-Value | Adjusted P-Value |
|---|---|---|---|---|---|
| Blend 2 - Blend 1 | -6.17 | 2.28 | (-12.55, 0.22) | -2.70 | 0.061 |
| Blend 3 - Blend 1 | -1.75 | 2.28 | (-8.14, 4.64) | -0.77 | 0.868 |
| Blend 4 - Blend 1 | 3.33 | 2.28 | (-3.05, 9.72) | 1.46 | 0.478 |
| Blend 3 - Blend 2 | 4.42 | 2.28 | (-1.97, 10.80) | 1.94 | 0.245 |
| Blend 4 - Blend 2 | 9.50 | 2.28 | (3.11, 15.89) | 4.17 | 0.002 |
| Blend 4 - Blend 3 | 5.08 | 2.28 | (-1.30, 11.47) | 2.23 | 0.150 |
- The confidence interval for the difference between the means of Blend 2 and Blend 4 extends from 3.11 to 15.89. This range does not include zero, which indicates that the difference is statistically significant.
- The confidence intervals for the remaining pairs of means all include zero, which indicates that the differences are not statistically significant.
- The 95% simultaneous confidence level indicates that we can be 95% confident that all of these confidence intervals contain the true differences.
- The 98.89% individual confidence level indicates that we can be 98.89% confident that each confidence interval contains the true difference for that specific comparison.
T-value
The t-value is a test statistic that measures the ratio between the difference in means and the standard error of the difference.
Interpretation
You can use the t-value to determine whether to reject the null hypothesis, which states that the difference in means is 0. However, most people use the p-value because it is easier to interpret. For more information on using the critical value, go to Using the t-value to determine whether to reject the null hypothesis.
Minitab uses the t-value to calculate the p-value.
Adjusted p-value
The adjusted p-value indicates which pairs within a family of comparisons are significantly different. The adjustment limits the family error rate to the alpha level that you specify. If you use a regular p-value for multiple comparisons, the family error rate increases with each additional comparison.
It is important to consider the family error rate when making multiple comparisons, because your chances of committing a type I error for a series of comparisons is greater than the error rate for any one comparison alone.
Interpretation
If the adjusted p-value is less than alpha, reject the null hypothesis and conclude that the difference between a pair of group means is statistically significant. The adjusted p-value also represents the smallest family error rate at which a particular null hypothesis is rejected.
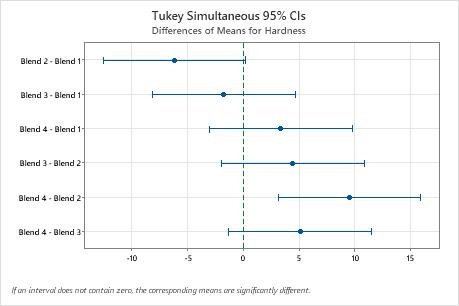
Interval plot for differences of means
Use the confidence intervals to determine likely ranges for the differences and to assess the practical significance of the differences. The graph displays a set of confidence intervals for the difference between pairs of means. Confidence intervals that do not contain zero indicate a mean difference that is statistically significant.
Depending on the comparison method you chose, the plot compares different pairs of groups and displays one of the following types of confidence intervals.
-
Individual confidence level
The percentage of times that a single confidence interval would include the true difference between one pair of group means if the study were repeated multiple times.
-
Simultaneous confidence level
The percentage of times that a set of confidence intervals would include the true differences for all group comparisons if the study were repeated multiple times.
Controlling the simultaneous confidence level is particularly important when you perform multiple comparisons. If you do not control the simultaneous confidence level, the chance that at least one confidence interval does not contain the true difference increases with the number of comparisons.
Interpretation
- The confidence interval for the difference between the means of Blend 4 and Blend 2 extends from 3.11 to 15.89. This range does not include zero, which indicates that the difference between these means is statistically significant.
- The confidence intervals for the remaining pairs of means all include zero, which indicates that the differences are not statistically significant.
- The 95% simultaneous confidence level indicates that we can be 95% confident that all of these confidence intervals contain the true differences.
- Each individual confidence interval has a confidence level of 98.89%. This result indicates that you can be 98.89% confident that each individual interval contains the true difference between a specific pair of group means. The individual confidence level for each comparison produce the 95% simultaneous confidence level for all six comparisons.
Tukey Simultaneous Tests for Differences of Means
| Difference of Levels | Difference of Means | SE of Difference | 95% CI | T-Value | Adjusted P-Value |
|---|---|---|---|---|---|
| Blend 2 - Blend 1 | -6.17 | 2.28 | (-12.55, 0.22) | -2.70 | 0.061 |
| Blend 3 - Blend 1 | -1.75 | 2.28 | (-8.14, 4.64) | -0.77 | 0.868 |
| Blend 4 - Blend 1 | 3.33 | 2.28 | (-3.05, 9.72) | 1.46 | 0.478 |
| Blend 3 - Blend 2 | 4.42 | 2.28 | (-1.97, 10.80) | 1.94 | 0.245 |
| Blend 4 - Blend 2 | 9.50 | 2.28 | (3.11, 15.89) | 4.17 | 0.002 |
| Blend 4 - Blend 3 | 5.08 | 2.28 | (-1.30, 11.47) | 2.23 | 0.150 |