You can add project lines to a time series plot.
The following images show the elements that you can display on a time series plot. To select elements when you create the graph, click Data View.
To add or remove elements after you create the graph, use the following steps.
- Double-click the graph to open the Options pane. The Options pane provides a subset of the possible graph editing options.
- Select More Options to open the Edit Graph dialog box and access all the graph editing options.
- Right-click the graph and choose .
Note
For information on adding or changing the grouping variables for an existing graph, go to Display groups on graphs.
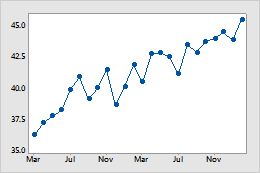
Symbols and connect line (default)
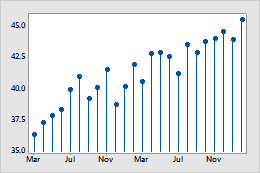
Symbols and project lines
Note
For more information on editing these graph features, go to the following topics.
