In This Topic
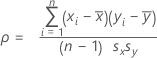
Pearson's correlation coefficient
Formula
Measures the degree of linear relationship between two variables. The correlation coefficient assumes a value between −1 and +1. If one variable tends to increase as the other decreases, the correlation coefficient is negative. Conversely, if the two variables tend to increase together the correlation coefficient is positive.
For the variables x and y:
Notation
| Term | Description |
|---|---|
 | sample mean for the first variable |
| sx | sample standard deviation for the first variable |
 | sample mean for the second variable |
| sy | sample standard deviation for the second variable |
| n | number of rows with no missing data for the pair of variables |
Pearson's correlation confidence intervals
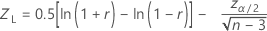
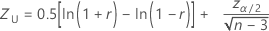
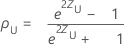
The (1− α)100% two-sided confidence interval for ρ is (ρL, ρU), where the lower bound, ρL, and the upper bound, ρU, follow:
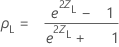

where:
Notation
| Term | Description |
|---|---|
| r | Pearson sample correlation estimate of the unknown correlation, ρ |
| ρ | correlation coefficient |
| n | number of rows with no missing data for the pair of variables |
Spearman's correlation coefficient
To calculate Spearman's correlation coefficient and p-value, perform a Pearson correlation on the ranks of the data. The ranks of tied responses are the average of the ranks of the ties. The table that follows shows the ranks for two samples of data.
| C1 | C2 | C3 | C4 |
|---|---|---|---|
| A | Rank A | B | Rank B |
| 45 | 4 | 23 | 1 |
| 78 | 6 | 25 | 3 |
| 24 | 3 | 25 | 3 |
| 51 | 5 | 25 | 3 |
| 13 | 1.5 | 34 | 6 |
| 13 | 1.5 | 30 | 5 |
Spearman's correlation coefficient between A and B is −0.678 and the p-value is 0.139. These values are identical to the coefficient and p-value from a Pearson correlation on the values in Rank A and Rank B.
Minitab omits rows that contain missing data for one or both variables from the calculations. Both columns must have the same number of rows.
Spearman's correlation confidence intervals
The (1− α)100% two-sided confidence interval for ρ is (ρL, ρU), where the lower bound, ρL, and the upper bound, ρU, follow:

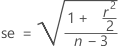
where:


Bonnett and Wright (2000) suggest using the following adjustment to the standard error:
Notation
| Term | Description |
|---|---|
| r | Spearman sample correlation estimate of the unknown correlation ρ |
| ρ | correlation coefficient |
| n | number of rows with no missing data for the pair of variables |
P-value
The hypotheses for a test that the correlation is 0 are as follows:
H0: ρ = 0 versus H1: ρ ≠ 0 where ρ is either the Pearson's correlation coefficient or the Spearman's correlation coefficient between a pair of variables.
Formula
The test statistics for Pearson's correlation coefficient and Spearman's correlation coefficient have the same formula:

The p-value is 2 × P(T > t) where T follows a t distribution with n – 2 degrees of freedom.
Notation
| Term | Description |
|---|---|
| r | sample correlation coefficient |
| n | number of rows with no missing data for the pair of variables |