Minitab includes the following attribute agreement graphs:
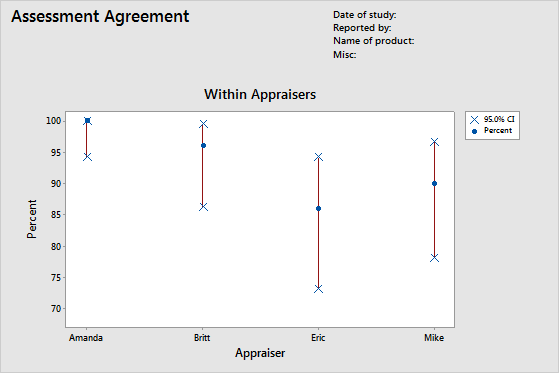
- Within Appraiser Assessment Agreement graph
- Use the Within Appraiser Assessment Agreement graph to see the consistency of each operator's ratings. If you have multiple trials, then Minitab plots the percentage of assessment agreement within appraiser.
-
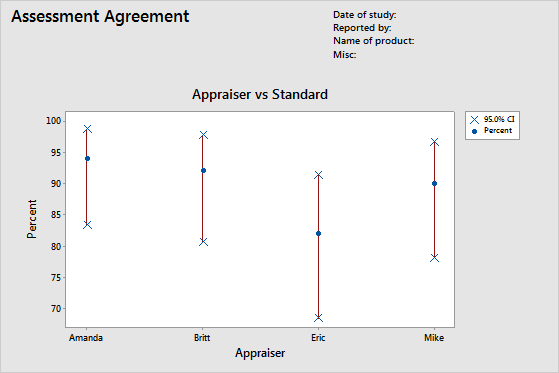
- Appraiser versus Standard Assessment Agreement graph
- Use the Appraiser versus Standard Assessment Agreement graph to see the correctness of each operator's ratings. If you have a known standard for each part, then the percentage matched between appraiser and standard is plotted.
-
Graph components
For each appraiser, the graphs have the following components:
- Circle
- In the Within Appraisers graph, the circle is the percentage of the parts that the operator measures consistently across all readings for each operator.
- Line
- In the Within Appraisers graph, the line represents the 95% confidence interval of the parts that the operator measures consistently across all readings for each operator.
- Xs
- The upper and lower and upper limits for the 95.0% confidence interval.