Select the method or formula of your choice.
In This Topic
Plotted points
The plotted points represent the defect rate for each subgroup,  :
:

Data points on a U chart follow the Poisson distribution.
Notation
| Term | Description |
|---|---|
 | number of defects for subgroup  |
 | size of subgroup  |
Center line
The center line represents the process mean,  . If you do not specify a historical value, then Minitab uses the mean from your data,
  , to estimate
  .
.

Notation
| Term | Description |
|---|---|
 | number of defects in subgroup  |
 | size of subgroup  |
Sigma Z
Each subgroup rate  is converted to a z-score (
 ):
):

Next, a moving range of length 2 is used to evaluate the variation in the z-scores and calculate Sigma Z ( ):
):
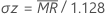
where 1.128 is an unbiasing constant.
Notation
| Term | Description |
|---|---|
 | defect rate for subgroup  |
 | process mean |
 | size of subgroup  |
 | moving range of length 2 |
Control limits
Lower control limit (LCL)
The LCL for each subgroup  is equal to the greater of the following:
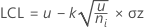
or

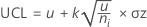
Upper control limit (UCL)
Notation
| Term | Description |
|---|---|
 | process mean |
 | parameter for Test 1. The default is 3. (For more information go to Select tests for special causes for Laney U' Chart.) |
 | size of subgroup  |
 | see "Sigma Z" |