Pp
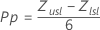
Pp is calculated using the parameter values that you specify or is estimated using maximum likelihood method for a distribution used in the analysis. Minitab calculates the Pp statistic using either the Z-Score method (default) or the ISO method, depending on the settings that are selected in . The following formulas are based on the default tolerance of K = 6, which is 6 standard deviations wide (3 standard deviations on each side of the process mean).
Z-Score method
Notation
| Term | Description |
|---|---|
| Zlsl | Φ–1(p1) |
| Zusl | Φ–1(p2) |
| Φ–1(p) | p * 100th percentile of a standard normal distribution |
| p1 | Prob (X ≤ LSL) |
| p2 | Prob (X ≤ USL) |
| X | X follows the distribution used in the analysis |
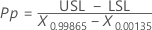
ISO method
Notation
| Term | Description |
|---|---|
| USL | Upper specification limit |
| LSL | Lower specification limit |
| X0.99865 | The 99.865th percentile for the specified distribution |
| X0.00135 | The 0.135th percentile for the specified distribution |
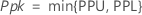
Ppk
PPM Total for expected "overall" performance
The expected number of parts per million that are outside of the specification limits is calculated as follows:
PPM Total (Exp. Overall) = PPM < LSL (Exp. Overall) + PPM > USL(Exp. Overall)
PPM Total (Exp. Overall) = [1,000,000 * F(LSL)]+ [1,000,000 * (1 – F(USL))]
Notation
| Term | Description |
|---|---|
| F(X) | The cumulative distribution function (CDF) of the distribution used in the analysis based on estimated or specified parameters |
| LSL | Lower specification limit |
| USL | Upper specification limit |
| PPM | Parts per million |
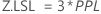
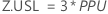
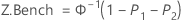
Z.Bench Z.LSL Z.USL
Benchmark Z statistics for overall capability are calculated by finding the Z value using the standard normal (0,1) distribution for the corresponding statistics.
Note
PPL and PPU are based on the method (ISO or Minitab) used in the analysis. For more information, go to Methods and formulas for overall capability measures in Nonnormal Capability Analysis. The formulas are based on the default tolerance of K = 6, which is 6 standard deviations wide (3 standard deviations on each side of the process mean).
Notation
| Term | Description |
|---|---|
| P1 | Probability (Observations < LSL) based on the nonnormal distribution used in the analysis and the parameters that you specify (or the parameters that are estimated from the data) |
| P2 | Probability (Observations > USL) based on the nonnormal distribution used in the analysis and the parameters that you specify (or the parameters that are estimated from the data) |
| Φ (X) | Cumulative distribution function (CDF) of a standard normal distribution |
| Φ–1 (X) | Inverse CDF of a standard normal distribution |