A manufacturing engineer receives weekly shipments of 2-inch plastic pipe segments for an assembly process. The lot size is 2500.
The engineer decides to implement a sampling plan to verify the pipe wall thickness. The lower specification for the pipe wall thickness is 0.09 inches. The engineer and the supplier agree that the AQL is 100 defectives per million and the RQL is 300 defectives per million.
- Choose .
- From the drop-down list, select Create a Sampling Plan.
- In Units for quality levels, select Defectives per million.
- In Acceptable quality level (AQL), enter 100.
- In Rejectable quality level (RQL or LTPD), enter 300.
- In Producer’s risk (Alpha), enter 0.05.
- In Consumer’s risk (Beta), enter 0.10.
- In Lower spec, enter 0.09.
- In Historical standard deviation, enter 0.025.
- In Lot size, enter 2500.
- Click OK.
Interpret the results
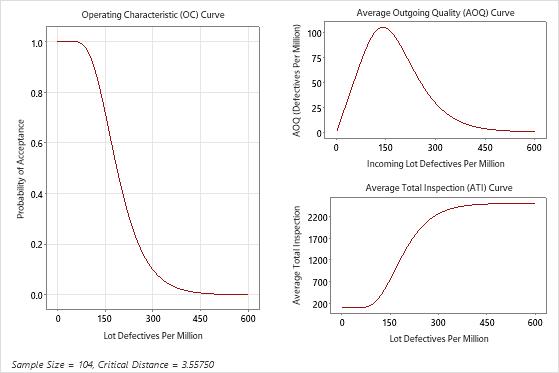
For each lot of 2500 pipe segments, the engineer should randomly select and measure the thickness of 104 pipes.
If Z.LSL is greater than the critical distance, in this case k = 3.55750, the engineer accepts the entire lot. Otherwise, the engineer rejects the entire lot.
In this case, the probability of acceptance at the AQL (100 defectives per million) is 0.95, and the probability of rejecting is 0.05. The engineer and the supplier agreed that lots of 100 defectives per million would be accepted approximately 95% of the time to protect the producer. The probability of accepting at the RQL (300 defectives per million) is 0.10, and the probability of rejecting is 0.90. The engineer and the supplier agreed that lots of 300 defectives per million would be rejected most of the time to protect the consumer.
- The average outgoing quality (AOQ) represents the average quality of the lot after additional inspection and rework. The AOQ level is 91.1 defectives per million at the AQL and 28.6 defectives per million at the RQL. The average outgoing quality limit (AOQL) = 104.6 at 140 defectives per million and represents the worse case outgoing quality level.
- The average total inspection (ATI) represents the average number of inspected items after additional inspection and rework. The ATI per lot represents the average number of pipes inspected at a particular quality level and probability of acceptance. For the quality level of 100 defectives per million, the average total number of pipes inspected per lot is 223.2. For the quality level of 300 defectives per million, the average total number of pipes inspected per lot is 2261.4.
Method
| Lower Specification Limit (LSL) | 0.09 |
|---|---|
| Historical Standard Deviation | 0.025 |
| Lot Size | 2500 |
| Acceptable Quality Level (AQL) | 100 |
| Producer’s Risk (α) | 0.05 |
| Rejectable Quality Level (RQL or LTPD) | 300 |
| Consumer’s Risk (β) | 0.1 |
Generated Plan(s)
| Sample Size | 104 |
|---|---|
| Critical Distance (k Value) | 3.55750 |
| Defectives Per Million | Probability Accepting | Probability Rejecting | AOQ | ATI |
|---|---|---|---|---|
| 100 | 0.950 | 0.050 | 91.1 | 223.2 |
| 300 | 0.100 | 0.900 | 28.6 | 2261.4 |
Average Outgoing Quality Limit(s) (AOQL)
| AOQL | At Defectives per Million |
|---|---|
| 104.6 | 140.0 |