Observação
Este comando está disponível com o Módulo de análise preditiva. Clique aqui saber mais sobre como ativar o módulo.
Visão geral
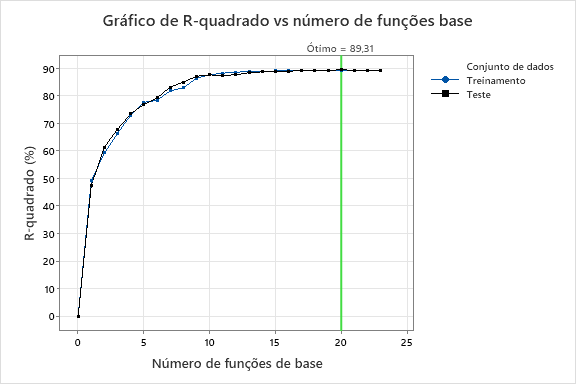
- The model that the analysis selects is part of a pattern where the criterion improves. Typically, you want to make predictions from a model with as much prediction accuracy as possible.
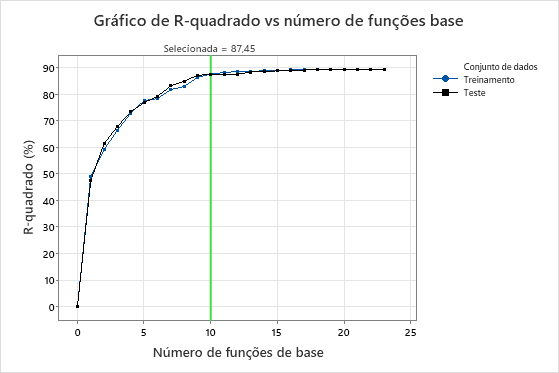
- The model that the analysis selects is part of a pattern where the criterion is relatively flat. One or more models with similar model summary statistics have much fewer basis functions than the optimal model. Typically, a model with fewer basis functions gives a clearer picture of how each predictor variable affects the response values. If the difference in prediction accuracy for a smaller model is negligible, you can use the smaller model to evaluate the relationships between the response and the predictor variables.
- The analyst chooses a smaller model that provides a clearer view of the most important variables.
- The analysis chooses a model because the basis functions are for variables that are easier to measure than the variables in another model.
- The analyst chooses a model because a particular region of the predictors is of interest.
Perform the analysis
Selecione Selecione o modelo alternativo na saída. A dialog box opens that shows a plot of the criterion against the number of basis functions and a table that summarizes the steps.
Compare os critérios
To select an alternative model, select a point on the graph or a row in the table. Selecionar Exibir resultados para criar os resultados desse modelo.
Once you display the results, you can select Predição to make predictions from the model. For more information, go to Predizer novos resultados para Regressão MARS®.
Dica
Para comparar a saída de duas análises diferentes relatórios, clique com o botão direito do mouse em Navegador e selecione Abrir em visualização dividida.