A healthcare consultant wants to compare the patient satisfaction ratings of two hospitals. Before collecting the data for a 2-sample t-test, the consultant uses a power and sample size calculation to determine the sample size required to detect a difference of 5 with a probability as high as 90% (power of 0.9). Previous studies indicate the ratings have a standard deviation of 10.
- Choose .
- In Differences, enter 5.
- In Power values, enter 0.9.
- In Standard deviation, enter 10.
- Click OK.
Interpret the results
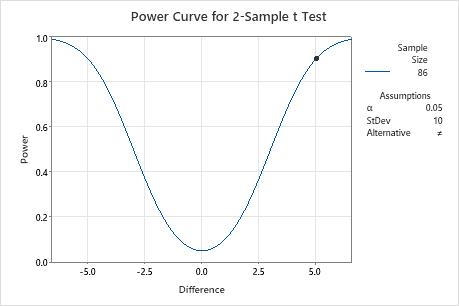
To detect a difference of 5 with a power of 0.9, the consultant needs to collect a minimum sample size of 86. Because the target power value of 0.9 results in a sample size that is not an integer, Minitab also displays the power (Actual Power) for the rounded sample size.
2-Sample t Test
Testing mean 1 = mean 2 (versus ≠)
Calculating power for mean 1 = mean 2 + difference
α = 0.05 Assumed standard deviation = 10
Results
| Difference | Sample Size | Target Power | Actual Power |
|---|---|---|---|
| 5 | 86 | 0.9 | 0.903230 |