What is a coefficient?
Coefficients are the numbers by which the variables in an equation are multiplied. For example, in the equation y = -3.6 + 5.0X1 - 1.8X2, the variables X1 and X2 are multiplied by 5.0 and -1.8, respectively, so the coefficients are 5.0 and -1.8.
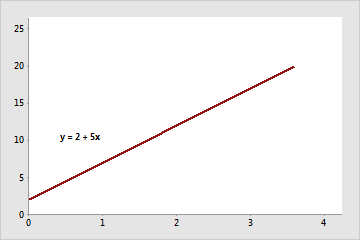
The coefficient (and slope) is positive 5.
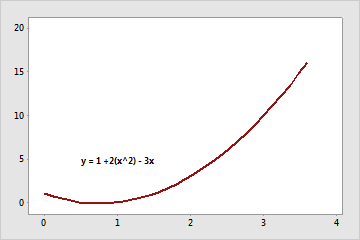
The coefficients are 2 and -3.
When calculating a regression equation to model data, Minitab estimates the coefficients for each predictor variable based on your sample and displays these estimates in a coefficients table. For example, the following coefficients table is shown in the output for a regression equation:
This equation predicts the heat flux in a home based on the position of its focal points, the insolation, and the time of day. Minitab displays the coefficient values for the equation in the second column:
Each coefficient estimates the change in the mean response per unit increase in X when all other predictors are held constant. For example, in the regression equation, if the North variable increases by 1 and the other variables remain the same, heat flux decreases by about 22.95 on average.
If the p-value of a coefficient is less than the chosen significance level, such as 0.05, the relationship between the predictor and the response is statistically significant. Minitab also includes a value for the constant in the equation in the Coef column.
Note
The term coefficient can also be used to denote a calculated numerical value used as an index, such as a coefficient of correlation, a coefficient of determination, or Kendall's coefficient.
Calculate confidence intervals for regression coefficients
Use the confidence interval to assess the reliability of the estimate of the coefficient. The wider the confidence interval, the less precise the estimate is.
- Choose .
- Complete the dialog box.
- Click Results.
- From Display of results, choose Expanded tables. Then click OK in each dialog box.
Note
By default, Minitab calculates 95% two-sided confidence intervals. To change the default settings, choose , then click Options. Then enter the confidence level and type of interval.