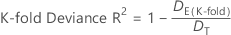
The deviance R2 indicates how much variation in the response is explained by the model. The higher the R2, the better the model fits your data. The formula is:
Notation
Term
Description
DE
Error Deviance
DT
Total Deviance
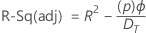
Adjusted Deviance R2
The adjusted deviance R2 accounts for the number of predictors in your model and is useful for comparing models with different numbers of predictors. The formula is:
Notation
Term
Description
R2
the deviance R2
p
the regression degrees of freedom
Φ
1, for binomial and Poisson models
DT
the total deviance
While the calculations for adjusted deviance R2 can produce negative values, Minitab displays zero for these cases.
Akaike Information Criterion (AIC)
Use this statistic to compare different models. The smaller AIC is, the better the model fits the data.
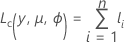
The log-likelihood functions are parameterized in terms of the means. The general form of the functions follow:
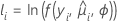
The general form of the individual contributions follows:
The specific form of the individual contributions depends on the model.
Model
li
Binomial
Poisson
Notation
Term
Description
p
the regression degrees of freedom
Lc
the log-likelihood of the current model
yi
the number of events for the ith row
mi
the number of trials for the ith row
the estimated mean response of the ith row
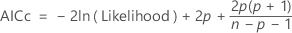
AICc (Akaike's Corrected Information Criterion)
AICc is not calculated when .
Notation
Term
Description
p
the number of coefficients in the model, including the constant
n
the number of rows in the data with no missing data
BIC (Bayesian Information Criterion)
Notation
Term
Description
p
the number of coefficients in the model, not counting the constant
n
the number of rows in the data with no missing data
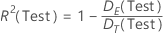
Test deviance R2
The test deviance R2 indicates how much of the variation
in the response of the test data set the model explains. The higher the value,
the better the model fits the test data.
Formula
The following equation gives the formula for the test deviance
R2:
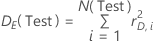
where the following equation represents the error deviance:
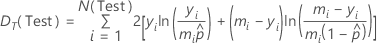
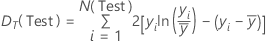
The formula for the total deviance,
DT(Test), depends on the form of the model.
Binary logistic
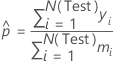
where for models with an intercept term,
has the following definition:
For models without an intercept term, use the inverse of the link
function at 0. The values for the link functions in Minitab follow:
Logit link function
= 0.5.
Normit link function
= 0.5.
Gompit link function
.
Poisson
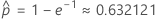
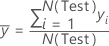
where for models with an intercept term
For models without an intercept term,
.
Notation
Term
Description
N(Test)
the number
of rows in the test data set
the squared deviance residuals
yi
the number of events for the
ith row in the test data set
mi
the number of trials for the
ith row in the test data set
DE(Test)
the error deviance for the test data
set
DT(Test)
the total
deviance for the test data set
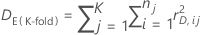
K-fold Deviance R2
The k-fold deviance R2 indicates how much of the
variation in the response of the validation data set the model explains. The
higher the value, the better the model fits the test data.
Where
and
DT is the total deviance.
Notation
Term
Description
K
number of
folds
nj
sample size of
fold
j
cross validated deviance residual for the
ith row of fold
j
Area under ROC curve
Formula
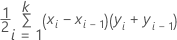
The area under the curve is the summation of areas of trapezoids:
where
k is the number of distinct event probabilities and
(x0,
y0) is the point (0, 0).
To compute the area for a curve from a test data set or from
cross-validated data, use the points from the corresponding curve.
For example, suppose we have four distinct event probabilities with the
following coordinates on the ROC curve:
x (false positive rate)
y (true
positive rate)
0.0923
0.3051
0.4154
0.7288
0.7538
0.9322
1
1
Then the area under the ROC curve is given by the following calculation:
Notation
Term
Description
TRP
true positive rate
FPR
false positive rate
TP
true positive, events that were correctly
assessed
P
number of actual positive
events
FP
true negative, nonevents that
were correctly assessed


 .
.
 has the following definition:
 = 0.5.
 = 0.5.
 .
.
 .
.