The values in the response information table describe the response variable.
For a binary response, the table includes the counts of events and non-events.
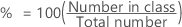
For a multinomial response, the table includes the counts in each class. The
table also shows the percentages of each class:
When you add validation with a separate test set to the out-of-bag
validation for the analysis, the table displays separate statistics for the
test set and the training set.
Class weights
For an analysis with class weights, Minitab provides the option to weight
the classes to ensure equal sample sizes across classes. For this type of
analysis, the most frequent class has a weight of 1. The following calculation
determines the weights for the remaining classes for a binary response, where
N represents the sample size:
The following calculation generalizes the class weights for a multinomial
response: