In This Topic
The misclassification table is not present when the splitting method is class probability.
Count
When there are no weights, the counts and the sample sizes are the same.
Weighted count
| Response level | Predicted level | Weight |
|---|---|---|
| Yes | Yes | 0.1 |
| Yes | Yes | 0.2 |
| Yes | No | 0.3 |
| Yes | No | 0.4 |
| No | No | 0.5 |
| No | No | 0.6 |
| No | Yes | 0.7 |
| No | Yes | 0.8 |
| Actual class | Weighted count | Misclassed | Predicted Class = No | Percent correct |
|---|---|---|---|---|
| Yes | 0.1 + 0.2 + 0.3 + 0.4 = 1 | 0.1 + 0.2 = 0.3 ≈ 0 | 0.3 + 0.4 = 0.7 ≈ 1 | (0.3 / 1.0) ×100 = 30% |
| No | 0.5 + 0.6 + 0.7 + 0.8 = 2.6 ≈ 3 | 0.7 + 0.8 = 1.5 ≈ 2 | 0.5 + 0.6 = 1.1 ≈ 1 | 1.1 / 2.6) × 100 = 42.31% |
| All | 1 + 2.6 = 3.6 ≈ 4 | 0.3 + 1.5 = 1.8 ≈ 2 | 0.7 + 1.1 = 1.8 ≈ 2 | (0.3 + 1.1) / 3.6 × 100 = 38.89% |
% Error
In the weighted case, use weighted counts in place of counts.

Cost
The calculation of cost depends on whether the response variable is binary or multinomial.
Cost = (% Error × Input misclassification cost for class) / 100
Binary response variable
The following equation gives the cost for the event class:
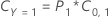
The following equation gives the cost for the non-event class:
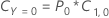
The following equation gives the overall cost for all classes:

Multinomial response variable

The following equation gives the overall cost for the multinomial case:

For example, consider a response variable with 3 classes and the following misclassification costs:
| Predicted Class | |||
| Actual class | 1 | 2 | 3 |
| 1 | 0.0 | 4.1 | 3.2 |
| 2 | 5.6 | 0.0 | 1.1 |
| 3 | 0.4 | 0.9 | 0.0 |
Then, consider that the following table gives the error percentages:
| Predicted Class | |||
| Actual class | 1 | 2 | 3 |
| 1 | N/A | 1% | 0.5% |
| 2 | 1.4% | N/A | 2.1% |
| 3 | 5% | 1.2% | N/A |
Finally, consider that the classes of the response variable have the following prior probabilities:


The following equation gives the overall cost:

