A safety analyst wants to compare the variability in steering correction times for experienced and inexperienced drivers on three types of roads: paved, gravel, and dirt. The analyst records the time in seconds that each driver uses to make steering corrections on each type of road.
- Open the sample data, RoadConditions.MWX.
- Choose .
- Select Response data are in one column for all factor levels.
- In Response, enter 'Correction Time'.
- In Factors, enter Experience and RoadType.
- Click OK.
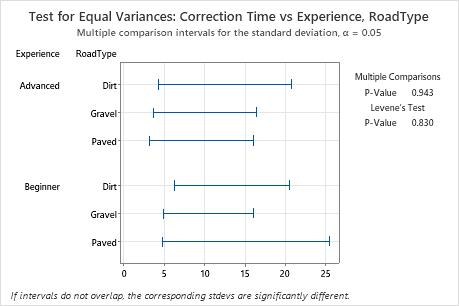
Interpret the results
In this summary plot, the p-values of 0.943 and 0.830 are greater than the common significance level of 0.05. None of the differences between the groups are statistically significant, and all the comparison intervals overlap.
Method
| Null hypothesis | All variances are equal |
|---|---|
| Alternative hypothesis | At least one variance is different |
| Significance level | α = 0.05 |
95% Bonferroni Confidence Intervals for Standard Deviations
| Experience | RoadType | N | StDev | CI |
|---|---|---|---|---|
| Advanced | Dirt | 4 | 5.09902 | (0.45310, 168.555) |
| Advanced | Gravel | 4 | 4.16333 | (0.42041, 121.108) |
| Advanced | Paved | 4 | 3.87298 | (0.31299, 140.776) |
| Beginner | Dirt | 4 | 6.05530 | (1.01104, 106.529) |
| Beginner | Gravel | 4 | 4.76095 | (0.89964, 74.009) |
| Beginner | Paved | 4 | 5.88784 | (0.52320, 194.630) |
Tests
| Method | Test Statistic | P-Value |
|---|---|---|
| Multiple comparisons | — | 0.943 |
| Levene | 0.42 | 0.830 |