An engineer who is responsible for a cereal packaging line wants to characterize the package filling process and to determine whether the sample data come from a symmetric distribution. The engineer records the fill weights of 100 cereal boxes.
The engineer creates a symmetry plot to examine the symmetry of the data distribution.
- Open the sample data, CerealBoxWeight.MWX.
- Choose .
- In Variables, enter Weight.
- Click OK.
Interpret the results
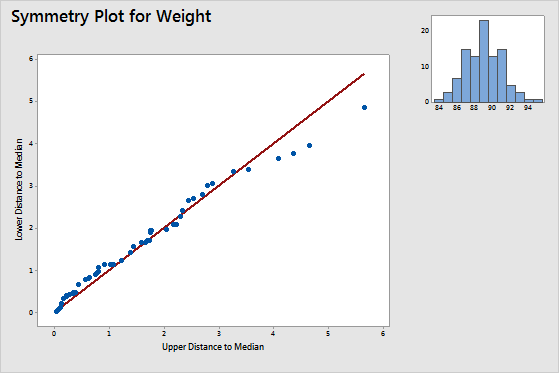
The data appear to be fairly symmetric. Notice the points below the line in the upper right corner of the symmetry plot. These points indicate a very slight diversion in the right side of the histogram. Because the points do not diverge from the line, the skewness in the data is mild.