In This Topic
Run chart
A run chart plots your process data in the order that they were collected. Use a run chart to look for patterns or trends in your data that indicate the presence of special-cause variation.
Interpretation
Patterns in your data indicate that the variation is due to special causes that should be investigated and corrected. However, common-cause variation is variation that is inherent or a natural part of the process. A process is stable when only common causes, not special causes, affect the process output. If only common causes of variation exist in your process, the data exhibit random behavior.
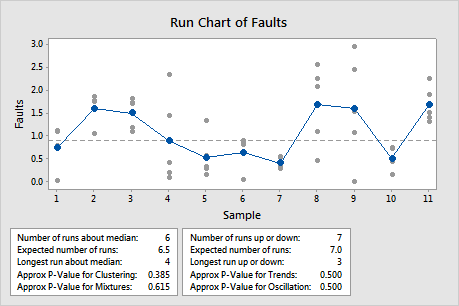
Number of runs about median
The number of runs about the median is the total number of runs above the median and the total number of runs below the median.
A run about the median is one or more consecutive points on the same side of the center line. A run ends when the line that connects the points crosses the center line. A new run begins with the next plotted point.
Interpretation
- Run 1 includes point 1.
- Run 2 includes points 2 and 3.
- Run 3 includes points 4, 5, 6, and 7.
- Run 4 includes points 8 and 9.
- Run 5 includes point 10.
- Run 6 includes point 11.
Expected number of runs about the median
The expected number of runs about the median is the number of runs that you would expect to have in your data if the data are randomly distributed.
Interpretation
Compare the expected number of runs with the actual number of runs. More runs than expected may indicate that data are from two populations (mixtures). Fewer runs than expected may indicate a clustering of data. Use the p-values to test for statistical significance.
Longest run about median
The number of points in the longest run above or below the median. A point that falls on the center line belongs to the run below the median.
Interpretation
Approximate p-value for clustering
The p-value is a probability that measures the evidence against the null hypothesis. Lower probabilities provide stronger evidence against the null hypothesis.
Use the p-value to determine whether the data are randomly distributed. The null hypothesis is that the data are randomly distributed.
Interpretation
A p-value that is less than the specified level of significance indicates a tendency for clustering. Usually, a significance level (denoted as α or alpha) of 0.05 works well. A significance level of 0.05 indicates a 5% risk of concluding that a nonrandom pattern exists when the data are actually randomly distributed.
- P-value ≤ α: The mean differences are significantly different (Reject H0)
- If the p-value is less than or equal to the significance level, you reject the null hypothesis. You can conclude that the data are not randomly distributed.
- P-value > α: The difference in the means are not significantly different (Fail to reject H0)
- If the p-value is greater than the significance level, you fail to reject the null hypothesis. You do not have enough evidence to conclude that the data have nonrandom patterns. However, you also cannot conclude that the data are randomly distributed.
Approximate p-value for mixtures
The p-value is a probability that measures the evidence against the null hypothesis. Lower probabilities provide stronger evidence against the null hypothesis.
Use the p-value to determine whether the data are randomly distributed. The null hypothesis is that the data are randomly distributed.
Interpretation
A p-value that is less than the specified level of significance indicates a tendency for mixtures. Usually, a significance level (denoted as α or alpha) of 0.05 works well. A significance level of 0.05 indicates a 5% risk of concluding that a nonrandom pattern exists when the data are actually randomly distributed.
- P-value ≤ α: The mean differences are significantly different (Reject H0)
- If the p-value is less than or equal to the significance level, you reject the null hypothesis. You can conclude that the data are not randomly distributed.
- P-value > α: The difference in the means are not significantly different (Fail to reject H0)
- If the p-value is greater than the significance level, you fail to reject the null hypothesis. You do not have enough evidence to conclude that the data have nonrandom patterns. However, you also cannot conclude that the data are randomly distributed.
Number of runs up or down
The number of runs up or down is the total count of upward and downward runs in your data.
A run up is an upward run of consecutive points that exclusively increases. A run down is a downward run of consecutive points that exclusively decreases. A run ends when the direction (either up or down) changes. For example, when the preceding value is smaller, a run up begins and continues until the proceeding value is larger than the next point, then a run down begins.
Minitab counts a flat run of consecutive equal observations as part of a downward run.
Interpretation
- Point 2 marks the end of Run 1.
- Point 5 marks the end of Run 2.
- Point 6 marks the end of Run 3.
- Point 7 marks the end of Run 4.
- Point 8 marks the end of Run 5.
- Point 10 marks the end of Run 6.
- Point 11 marks the end of Run 7.
How to interpret a flat run
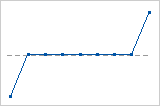
3 runs up and down
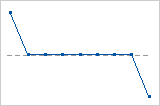
1 run down
Expected number of runs up or down
The expected number of runs up or down is the number of runs that you would expect to have in your data if the data are randomly distributed.
Interpretation
Compare the expected number of runs with the actual number of runs. More runs than expected may indicate oscillation in the data. Fewer runs than expected may indicate a trend in the data. Use the p-values to test for significance.
Longest run up or down
The number of points in the longest run up or down.
Interpretation
Approximate p-value for trends
The p-value is a probability that measures the evidence against the null hypothesis. Lower probabilities provide stronger evidence against the null hypothesis.
Use the p-value to determine whether the data are randomly distributed. The null hypothesis is that the data are randomly distributed.
Interpretation
A p-value that is less than the specified level of significance indicates a tendency for trends. Usually, a significance level (denoted as α or alpha) of 0.05 works well. A significance level of 0.05 indicates a 5% risk of concluding that a nonrandom pattern exists when the data are actually randomly distributed.
- P-value ≤ α: The mean differences are significantly different (Reject H0)
- If the p-value is less than or equal to the significance level, you reject the null hypothesis. You can conclude that the data are not randomly distributed.
- P-value > α: The difference in the means are not significantly different (Fail to reject H0)
- If the p-value is greater than the significance level, you fail to reject the null hypothesis. You do not have enough evidence to conclude that the data have nonrandom patterns. However, you also cannot conclude that the data are randomly distributed.
Approximate p-value for oscillation
The p-value is a probability that measures the evidence against the null hypothesis. Lower probabilities provide stronger evidence against the null hypothesis.
Use the p-value to determine whether the data are randomly distributed. The null hypothesis is that the data are randomly distributed.
Interpretation
A p-value that is less than the specified level of significance indicates a tendency for oscillation. Usually, a significance level (denoted as α or alpha) of 0.05 works well. A significance level of 0.05 indicates a 5% risk of concluding that a nonrandom pattern exists when the data are actually randomly distributed.
- P-value ≤ α: The mean differences are significantly different (Reject H0)
- If the p-value is less than or equal to the significance level, you reject the null hypothesis. You can conclude that the data are not randomly distributed.
- P-value > α: The difference in the means are not significantly different (Fail to reject H0)
- If the p-value is greater than the significance level, you fail to reject the null hypothesis. You do not have enough evidence to conclude that the data have nonrandom patterns. However, you also cannot conclude that the data are randomly distributed.