Measurement stability is the change in bias over time. It represents the total variation in measurements of the same part measured over time. This variation over time is called drift.
You can use a control chart to monitor the stability of a measurement process by measuring a master or control part on the same system over time. As measurements are taken, points within the limits indicate that the process has not changed, and points outside the limits indicate that the process has changed. Knowledge of the equipment and measurement conditions help identify special causes when the system is unstable.
Example of using a control chart to assess measurement stability
An engineer measures a master color sample every shift to confirm that the densitometer in is range and can effectively monitor the printing process.
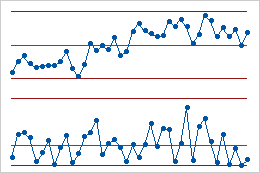
Control chart of density measurements
The control chart indicates the process is drifting.
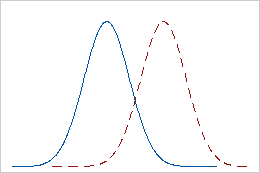
Histograms of density measurements
The solid line represents the measurements taken in September. The dashed line represents the measurements taken in October. The difference in the means of these distributions represents the measurement stability or drift. You can also perform a 2-sample t-test to determine whether the difference is statistically significant.