If you enter more than one column, Minitab creates a separate control chart for each column. Select Same Y to use the same y-scale for each control chart.
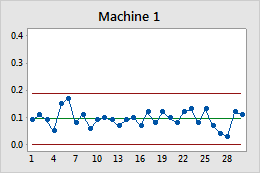
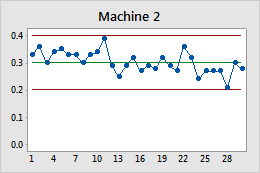
In this example, the measurements for Machine 2 are larger than those of Machine 1. By default, the ranges on the y-scales of the charts are different. When you select Same Y, Minitab uses the same range for the y-scale on both charts.
- Default
-
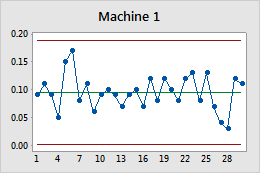
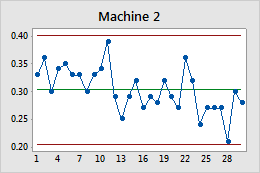
- Same Y
-