Each plotted point represents the proportion of defectives for one subgroup, pi:
Data points on a P chart follow the binomial distribution.
Notation
Term
Description
xi
number of defectives for subgroup i
ni
size of subgroup i
Center line
The center line represents the proportion of defectives for your process, . If you do not specify a historical value, then Minitab uses the average proportion of defectives from your data, , to estimate .
Notation
Term
Description
number of defectives in subgroup
size of subgroup
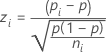
Sigma Z
Each subgroup proportion is converted to a z-score ():
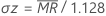
Next, a moving range of length 2 is used to evaluate the variation in the z-scores and calculate Sigma Z ():
where 1.128 is an unbiasing constant.
Notation
Term
Description
proportion of defectives for subgroup
process proportion
size of subgroup
moving range of length 2
Control limits
Lower control limit (LCL)
The LCL for each subgroup is equal to the greater of the following:
or
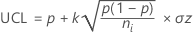
Upper control limit (UCL)
The UCL for each subgroup is equal to the lesser of the following:

 . If you do not specify a historical value, then Minitab uses the average proportion of defectives from your data,
  , to estimate
  .
.


 is converted to a z-score (
 ):
):
 ):
):


 is equal to the greater of the following:
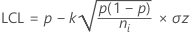

 is equal to the lesser of the following: