To create a scatterplot with regression fit lines and groups, complete the steps for the option that best describes your data.
Groups are defined by values in categorical variables
Complete the following steps if your groups are defined by values in a grouping variable, or unique combinations of values in multiple grouping variables.
- Specify the pairs of variables to appear on your graph.
- In Y variables, enter the column that you want to explain or predict.
- In X variables, enter a corresponding column that might explain or predict changes in the Y variable.
- In Categorical variables for grouping (0-3), enter up to three columns that define the groups.
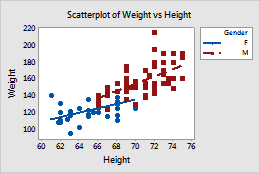
In this worksheet, Weight is the Y variable and Height is the X variable. Gender is the categorical variable for grouping. The graph shows the relationship between height and weight for each gender, which is represented by the fitted regression lines.
| C1 | C2 | C3 |
|---|---|---|
| Height | Weight | Gender |
| 66.0 | 140 | M |
| 61.0 | 140 | F |
| 72.0 | 145 | M |
| ... | ... | ... |
Groups are pairs of X-Y variables
Complete the following steps if you have multiple pairs of numeric or date/time columns and each pair is a group.
- Specify the pairs of variables to appear on your graph.
- In Y variables, enter multiple columns that you want to explain or predict.
- In X variables, for each Y variable, enter the corresponding numeric column that might explain or predict changes in the Y variable.
- Select X-Y pairs form groups.
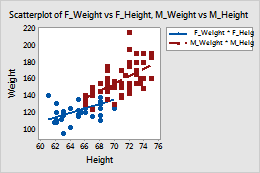
In this worksheet, M_Weight is the first Y variable and M_Height is the corresponding X variable. F_Weight is the second Y variable and F_Height is the corresponding X variable. Each set of Y and X variables forms a group. The graph shows the relationship between height and weight for each gender, which is represented by the fitted regression lines.
| C1 | C2 | C3 | C4 |
|---|---|---|---|
| M_Height | M_Weight | F_Height | F_Weight |
| 66.00 | 140 | 61.00 | 140 |
| 72.00 | 145 | 66.00 | 120 |
| 73.50 | 160 | 68.00 | 130 |
| ... | ... | ... | ... |