A medical researcher studies obesity in adolescent girls. Because body fat percentage is difficult and expensive to measure directly, the researcher wants to determine whether the body mass index (BMI)—a measurement that is easy to take—is a good predictor of body fat percentage. The researcher collects BMI, body fat percentage, and other personal variables of 92 adolescent girls.
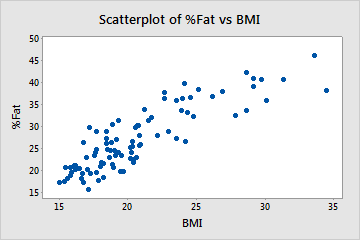
As part of the initial investigation, the researcher creates a scatterplot of the body fat percentage vs. BMI to evaluate the relationship between the two variables.
- Open the sample data, BodyFatPercentage.MWX.
- Choose .
- Under Y variables, enter %Fat.
- Under X variables, enter BMI.
- Click OK.
Interpret the results
The scatterplot of the BMI and body fat data shows a strong positive and linear relationship between the two variables. Body mass index (BMI) may be a good predictor of body fat percentage.