Medical researchers want to evaluate the effects that different drugs may have on the growth of various types of bacteria. They conduct an experiment applying 10 types of drugs to six types of bacteria over three weeks. They also set up a control group where the bacteria grows without the presence of any drug.
After the three-week period, the researchers record the number of cells of bacteria for each group.
- Open the sample data, BacteriaGrowth.MWX.
- Choose .
- In Variables, enter c2-c7.
- In Label column (optional), enter Drug Type.
- Click OK.
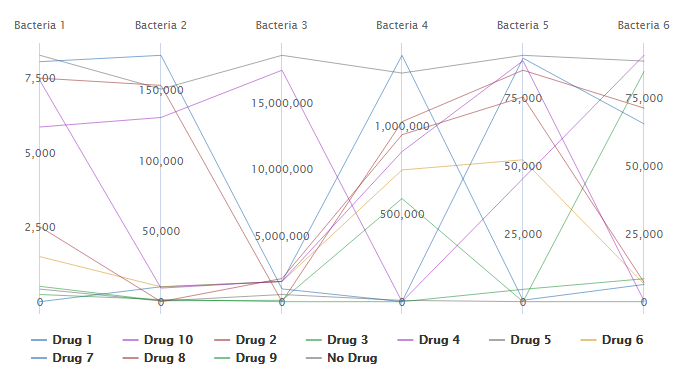
Interpret the results
The medical researcher wants to determine which drugs minimize growth for each type of bacteria. The line running along the top of the plot shows the growth of each bacteria without the presence of any drug. Drug 1 has a low value of growth for bacteria 1, 2, 3, 5, and 6. But the growth for bacteria 4 is actually higher for Drug 1 than the sample with no drug. Drug 5 and Drug 9 have the lowest amount of growth across all 6 types of bacteria. The researcher decides to focus on these two drugs for more detailed experiments.