Complete the following steps to specify the data for your graph.
- In Graph variables, enter 2 to 20 columns of numeric or date/time data with the same number of rows. Minitab displays a scatterplot for each combination of variables.
- In Categorical variables for grouping (0-3), enter up to three columns that define the groups.
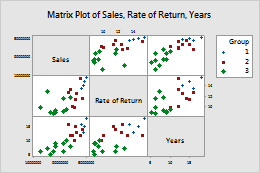
In this worksheet, Rate of Return, Sales and Years are the graph variables, and Group is the categorical variable. The graph shows the relationships between each possible combination of the three graph variables, divided into groups.
| C1 | C2 | C3 | C4 |
|---|---|---|---|
| Rate of Return | Sales | Years | Group |
| 15.4 | 50400200 | 18 | 1 |
| 11.3 | 42100650 | 15 | 2 |
| 9.9 | 39440420 | 12 | 2 |
| ... | ... | ... | ... |