Complete the following steps to specify the data for your graph.
- In Y variable, enter the column that you want to explain or predict.
- In X variable, enter a corresponding column that might explain changes in the Y variable.
- In Bubble size variable, enter a column that determines the size (area) of the bubbles.
- In Panel variables (optional):, enter up to two columns that define panels. Minitab displays each unique combination of values on a separate panel.
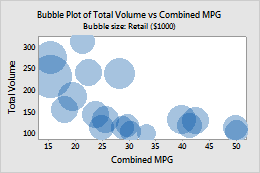
In this worksheet, Total Volume is the Y variable, Combined MPG is the X variable, and Retail ($1000) is the bubble size variable. The graph shows the relationship between total volume, combined MPG, and retail cost.
| C1 | C2 | C3 |
|---|---|---|
| Total Volume | Combined MPG | Retail ($1000) |
| 187.0 | 19.25 | 31.3 |
| 132.3 | 25.50 | 31.0 |
| `32.3 | 39.55 | 35.6 |
| ... | ... |