Individual and composite desirability assess how well a combination of variables satisfies the goals you have defined for the responses. Individual desirability (d) evaluates how the settings optimize a single response; composite desirability (D) evaluates how the settings optimize a set of responses overall. Desirability has a range of zero to one. One represents the ideal case; zero indicates that one or more responses are outside their acceptable limits.
For example, a chemical engineer wants to maximize the yield of a chemical reaction by varying three variables: reaction time, reaction temperature, and type of catalyst. At the same time, they want to minimize cost, which is also affected by the three variables. Using the Response Optimizer, the engineer defines target goals for yield and cost. Minitab calculates optimal settings for the variables along with desirability values to identify how well those settings achieve the response targets.
Here, the composite desirability (0.9245) is close to 1, which indicates the settings seem to achieve favorable results for all responses as a whole. However, the individual desirability indicates that the settings are more effective at maximizing yield (0.98077) than at minimizing cost (0.87136). If minimizing cost is more important, the engineer might want to adjust the settings using an optimization plot, to achieve higher individual desirability for cost and lower individual desirability for yield.
Minitab's Response Optimizer calculates individual desirability using a desirability function (also called utility transfer function). You select a weight (from 0.1 to 10) to determine how much to emphasize obtaining the target value. Composite desirability is the weighted geometric mean of the individual desirabilities for the responses. Minitab determines optimal settings for the variables by maximizing the composite desirability.
Examples of how combinations of parameters create desirability functions
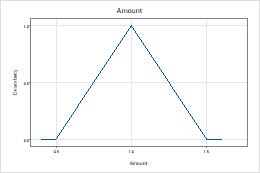
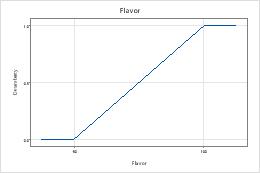
The following graphs show how the combination of parameters for the fondue data responses flavor and amount create the desirability function.
| Goal | Lower | Target | Upper | Weight | Import |
|---|---|---|---|---|---|
| Maximum | 60 | 100 | 100 | 1 | 2 |
| Goal | Lower | Target | Upper | Weight | Import |
|---|---|---|---|---|---|
| Maximum | 0.5 | 1 | 1.5 | 1 | 1 |