Use a cube plot to show the relationship between factors and a response. Each cube can show three factors. If there are only two factors, Minitab displays a square plot. Minitab draws as many cubes as necessary to show up to eight factors. You can create a cube plot with or without response means. Viewing the factors without the response allows you to see what a design looks like. If you display the response means, you can choose between two types of means:
- Data means are the average of the raw data for each combination of factor levels.
- Fitted means are the predicted values for each combination of factor levels based on the model that you fit.
Note
For mixture designs, cube plots display only data means. For more information about the types of means, go to Data and fitted means.
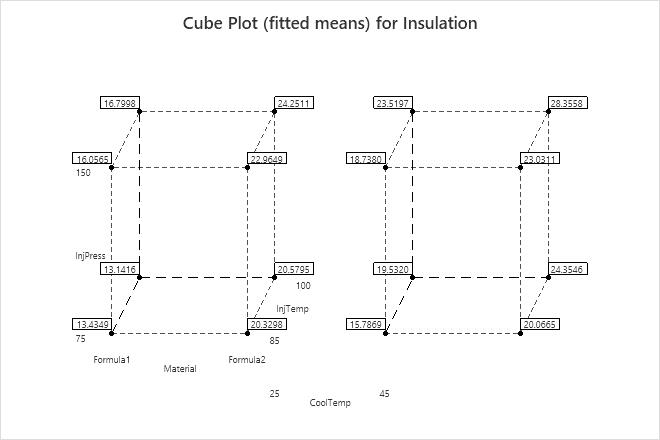
Key Results: Cube Plot
For the insulation data, two cubes display all combinations of factor settings for the four factors and the fitted mean for each combination. The cube on the left shows the response means when cooling temperature is 25. The cube on the right shows the response means when cooling temperature is 45. Use the fitted means on the cube plot to assess the model predictions at all the points in the design.
For example, the combination of CoolTemp 45, Formula2, InjTemp 100, and InjPress 150 is associated with the highest fitted mean of insulating value (28.3558).