A materials engineer for a building products manufacturer is developing a new insulation product. The engineer designs a 2-level full factorial experiment to assess several factors that could impact the strength, density, and insulating value of the insulation.
The engineer uses Analyze Factorial Design to fit the model and then uses Cube Plot to display the fitted means for the experimental conditions.
- Open the sample data, InsulationProperties_model.MWX.
- Choose .
- Under Type of means to use in plots, select Fitted means.
- From Response, select Insulation.
- Under Variables to Include in Plots, move Material, InjPress, InjTemp, and CoolTemp from the Available list to the Selected list.
- Click OK.
Interpret the results
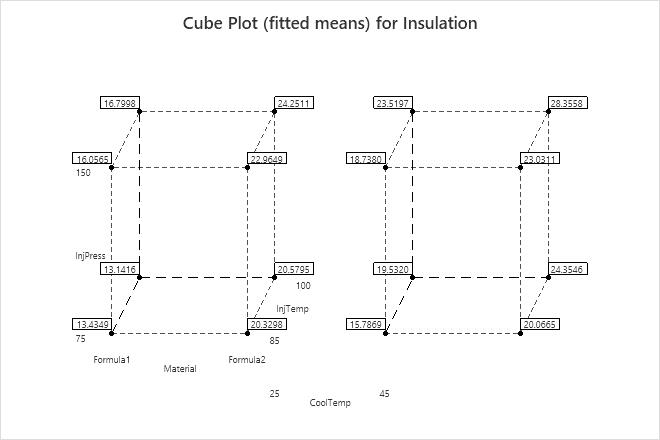
For the insulation data, two cubes display all combinations of factor settings for the four factors and the fitted mean for each combination. The cube on the left shows the response means when cooling temperature is 25. The cube on the right shows the response means when cooling temperature is 45. Use the fitted means on the cube plot to assess the model predictions at all the points in the design.
For example, the combination of CoolTemp 45, Formula2, InjTemp 100, and InjPress 150 is associated with the highest fitted mean of insulating value (28.3558).