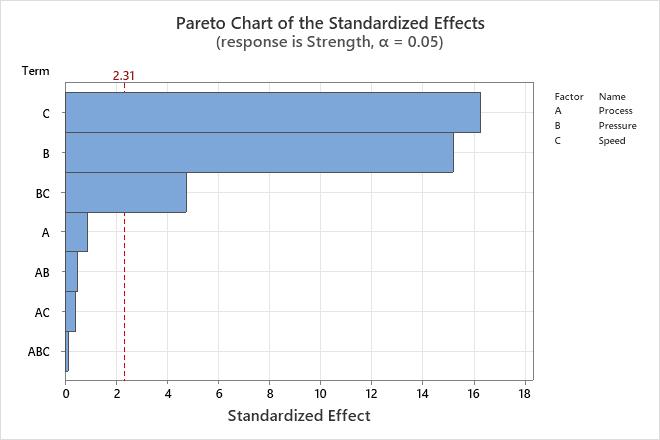
The Pareto chart shows the absolute values of the standardized effects from the largest effect to the smallest effect. The chart also plots a reference line to indicate which effects are statistically significant.
The reference line for statistical significance depends on the significance level (denoted by α or alpha). Unless you specify a stepwise selection method that defines an alpha value, the significance level is 1 minus the confidence level for the analysis. For more information on how to change the confidence level, go to Select the options for Fit Regression Model and Linear Regression. If you use backwards selection or stepwise selection, the significance level is the significance level where Minitab removes a term from the model, known as Alpha to remove. If you use forward selection, the significance level is the significance level where Minitab adds a term to the model, known as Alpha to enter.
Interpretation
Use the Pareto chart to determine the magnitude and the importance of the effects. On the Pareto chart, bars that cross the reference line are statistically significant. For example, in this Pareto chart, the bars that represent factors C, B, and BC cross the reference line that is at 2.31. These factors are statistically significant at the 0.05 level with the current model terms.
Because the Pareto chart displays the absolute value of the effects, you can determine which effects are large but you cannot determine which effects increase or decrease the response. Use the Coefficients table to examine the magnitude and direction of the effects.