A research chemist wants to understand how several predictors are associated with the wrinkle resistance of cotton cloth. The chemist examines 32 pieces of cotton cellulose produced at different settings of curing time, curing temperature, formaldehyde concentration, and catalyst ratio. The durable press rating, a measure of wrinkle resistance, is recorded for each piece of cotton.
The chemist performs a multiple regression analysis to fit a model with the predictors and eliminate the predictors that do not have a statistically significant relationship with the response.
Choose Stat > Regression > Regression > Fit Regression Model.
In Responses, enter Rating.
In Continuous
predictors, enter ConcRatioTempTime.
Click Graphs.
Under Effects Plots, check Pareto.
Under Residuals plots, choose Four in one.
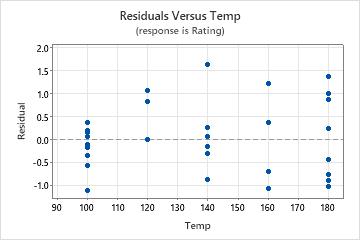
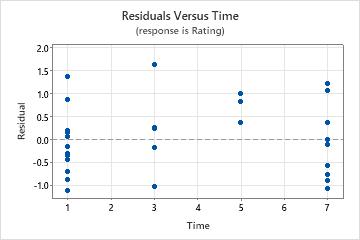
In Residuals versus the
variables, enter ConcRatioTempTime.
Click OK in each dialog box.
Interpret the results
The predictors temperature, catalyst ratio, and formaldehyde concentration have p-values that are less than the significance level of 0.05. These results indicate that these predictors have a statistically significant effect on wrinkle resistance. The p-value for time is greater than 0.05, which indicates that there is not enough evidence to conclude that time is related to the response. The chemist may want to refit the model without this predictor.
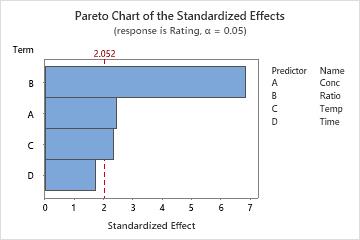
The Pareto chart shows that the effects for temperature, catalyst ratio, and formaldehyde concentration are statistically significant at the 0.05 level of significance. The largest effect is catalyst ratio because it extends the farthest. The effect for time is the smallest because it extends the least.
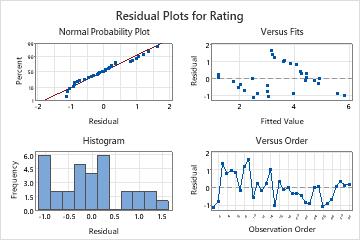
The residual plots indicate that there may be problems with the model.
The points on the residuals versus fits plot do not appear to be randomly distributed about zero. There appear to be clusters of points that could represent different groups in the data. The chemist should investigate the groups to determine their cause.
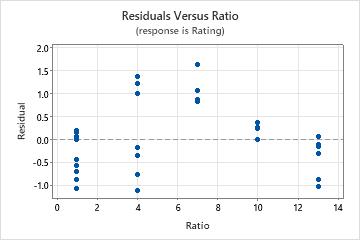
The plot of the residuals versus ratio shows curvature, which suggests a curvilinear relationship between catalyst ratio and wrinkles. The chemist should consider adding a quadratic term for ratio to the model.
Regression Equation
Rating
=
-0.756 + 0.1545 Conc + 0.2171 Ratio + 0.01081 Temp + 0.0946 Time