If you add validation with a test set to the out-of-bag validation, then the table includes separate statistics for the training set and the test set.
N
The table includes this statistic when you add validation with a test set. The numbers are how many non-missing response values are in the test and training sets.
% of N
The table includes this statistic when you add validation with a test set. The numbers are the percentage of observations that are in the training data set and that are in the test data set.
Mean
A commonly used measure of the center of a batch of numbers. The mean is also called the average. It is the sum of all observations divided by the number of (nonmissing) observations.
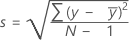
StDev
 with mean
  , then the standard deviation of the sample is:
| Term | Description |
|---|---|

|  observation
 |
 | mean of the observations |
| N | number of nonmissing observations |
Minimum
The smallest value in the data set.
Q1
25% of your sample observations are less than or equal to the value of the 1st quartile. Therefore, the 1st quartile is also referred to as the 25th percentile.
Median
The sample median is in the middle of the data: at least half the observations are less than or equal to it, and at least half are greater than or equal to it.
Suppose you have a data set that contains N values. To calculate the median, first order your data values from smallest to largest. If N is odd, the sample median is the value in the middle. If N is even, the sample median is the average of the two middle values.
Q3
75% of your sample observations are less than or equal to the value of the third quartile. Therefore, the third quartile is also referred to as the 75th percentile.
Maximum
The largest value in the data set.