Note
This command is available with the Predictive Analytics Module. Click here for more information about how to activate the module.

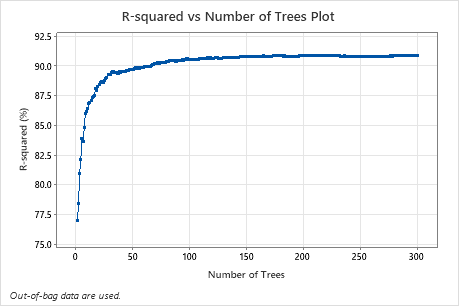
For this analysis, the number of observations is 2930. Each of the 300 bootstrap samples randomly selects 2930 observations, with replacement, to create a tree. The R2 value is approximately 90.90%.
Interpretation
Higher values of R2 indicate a better model. A line that converges suggests that the number of trees is sufficient. If the line does not converge, then rerun the analysis with a larger number of bootstrap samples to see whether more trees gives better prediction results. If the model seems insufficient, consider whether to retry the analysis with alternative settings, such as the number of predictors for node splitting or the minimum number of cases to split an internal node.
