In This Topic
Step 1: Estimate the standard deviation of each population
Use the Bonferroni confidence intervals to estimate the standard deviation of each population based on your categorical factors. Each confidence interval is a range of likely values for the standard deviation of the corresponding population.
Minitab adjusts the Bonferroni confidence intervals to maintain the simultaneous confidence level. With 95% Bonferroni confidence intervals, you can be 95% confident that the entire set of confidence intervals includes the true population standard deviations for all groups.
Controlling the simultaneous confidence level is especially important when you perform multiple comparisons. If you do not control the simultaneous confidence level, the chance that at least one confidence interval does not contain the true standard deviation increases with the number of confidence intervals.
Note
You cannot use the Bonferroni confidence intervals to determine whether the differences between pairs of groups are statistically significant. To determine the statistical significance of the differences between pairs of groups, use the multiple comparison intervals in step 2.
For more information, go to Using confidence levels to identify significant differences between factor levels in multiple comparisons and What is the Bonferroni method?.
Method
| Null hypothesis | All variances are equal |
|---|---|
| Alternative hypothesis | At least one variance is different |
| Significance level | α = 0.05 |
95% Bonferroni Confidence Intervals for Standard Deviations
| Fertilizer | N | StDev | CI |
|---|---|---|---|
| GrowFast | 50 | 4.28743 | (3.43659, 5.61790) |
| None | 50 | 5.09137 | (4.24793, 6.40914) |
| SuperPlant | 49 | 5.49969 | (4.48577, 7.08914) |
Key Results: StDev, 95% Bonferroni Confidence Intervals, Individual confidence level
In these results, the Bonferroni confidence intervals indicate that you can be 95% confident that the entire set of confidence intervals includes the true population standard deviations for all groups. Also, the individual confidence level indicates how confident you can be that an individual confidence interval contains the population standard deviation of that specific group. For example, you can be 98.3333% confident that the standard deviation for the GrowFast population is within the confidence interval (3.43659, 5.61790).
Step 2: Determine whether the population standard deviations are different
Use the summary plot to determine whether any of the differences between the standard deviations are statistically significant. The types of tests and intervals that Minitab displays depends on whether you checked Use test based on normal distribution in the Options sub-dialog box and on the number of groups in your data.
- P-values for the tests
-
Use the p-values on the summary plot to determine whether any of the differences between the standard deviations are statistically significant. Minitab displays the results of either one or two tests that assess the equality of variances. If you have two p-values and they disagree, go to All Statistics and graphs and click "Tests" for information about which test to use.
Compare the p-value to your significance level to assess the null hypothesis. The null hypothesis is that the group standard deviations are all equal. Usually, a significance level (denoted as α or alpha) of 0.05 works well. A significance level of 0.05 indicates a 5% risk of concluding that a difference exists when there is no actual difference.
Use the following guidelines to interpret the p-values:- If the p-value is > α, the differences between the standard deviations are not statistically significant.
- If the p-value is ≤ α, the differences between some of the standard deviations are statistically significant.
- Multiple comparison intervals
-
If you did not select Use test based on normal distribution, the summary plot displays confidence intervals for the multiple comparisons method. In general, you can base your conclusions on the multiple comparisons test and the multiple comparison intervals, unless you have small samples from very skewed or heavy-tailed distributions.
Use the multiple comparison intervals to identify specific pairs of standard deviations that are not equal. If two intervals do not overlap, the difference between the corresponding standard deviations is statistically significant. If the p-value for the multiple comparisons test is less than your significance level, at least one pair of intervals does not overlap.
- Bonferroni confidence intervals
-
If you selected Use test based on normal distribution, the summary plot displays Bonferroni confidence intervals to estimate the standard deviation of each population. You cannot use these intervals to determine whether the differences between pairs of groups are statistically significant. Go to step 1 for more information about how to interpret Bonferroni confidence intervals.
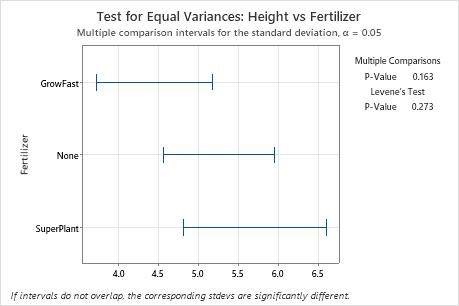
Key Results: Multiple Comparisons P-value
In this summary plot, the p-value for the multiple comparisons test is greater than the significance level of 0.05. None of the differences between the groups are statistically significant, and all the comparison intervals overlap.