A safety analyst wants to compare how well experienced and inexperienced drivers drive on three types of roads: paved, gravel, and dirt. To measure driving performance, the analyst records the time in seconds that each driver uses to make steering corrections on each type of road.
The analyst performs an analysis of means to determine whether the means for experience level and type of road are different from the overall mean.
- Open the sample data, RoadConditions.MWX.
- Choose .
- In Response, enter 'Correction Time'.
- Under Distribution of Data, select Normal.
- In Factor 1, enter Experience.
- In Factor 2, enter RoadType.
- Click OK.
Interpret the results
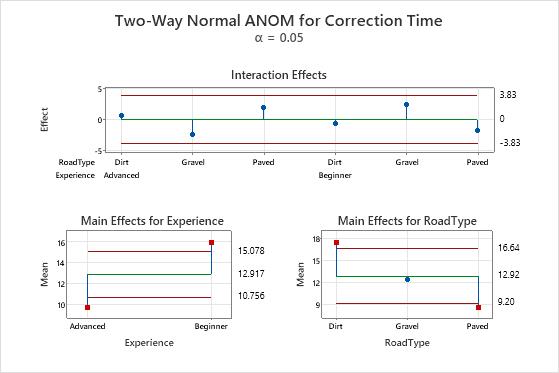
Minitab displays three plots with a two-way analysis of means (ANOM) design to show the interaction effects, main effects for the first factor, and main effects for the second factor. Analysis of means plots have a center line and decision limits. If a point falls outside the decision limits, then there is significant evidence that the mean represented by that point is different from the overall mean of the sample. With a two-way analysis of means, assess the interaction effects first. If the interaction effects are statistically significant, you cannot interpret the main effects without considering the interaction effects.
In this plot, the interaction effects are well within the decision limits, which indicates that the interaction effects are not statistically significant. Next, assess the main effects. The lower two plots show the means for the levels of the two factors. The main effect is the difference between the mean and the center line.
In the main effects plot for experience, the points that represent the factor level means for both the advanced and beginner experience are outside the decision limits. This condition indicates that the difference between each of these means and the overall mean is statistically significant. You can conclude that advanced drivers have a significantly lower mean correction time and beginner drivers have a significantly higher mean correction time.
Similarly, in the main effects plot for road type, the main effects for dirt and paved roads are outside the decision limits, which indicates that these main effects are statistically significant. However, the main effect for gravel roads is not statistically significant.