Use Run Chart to look for patterns or trends in your data that indicate the presence of special-cause variation. A run chart plots your process data in the order that they were collected.
Minitab tests for randomness in order to detect whether nonrandom patterns, such as trends, oscillation, clustering, and mixtures, are statistically significant.
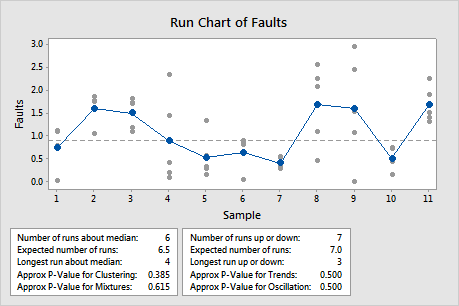
In this chart, most of the data appear to be randomly distributed with no obvious patterns. The tests for randomness do not reveal any statistically significant evidence of trends or other nonrandom patterns.
Where to find this chart
To create a run chart, choose .
When to use an alternate analysis
Use a control chart instead of a run chart when you want to calculate control limits to monitor your process and determine whether it is in control.