What is a multivariate control chart?
Multivariate control charts are a type of variables control chart that shows how correlated, or dependent, variables jointly affect a process or outcome. For example, you can use a multivariate control chart to investigate if temperature and pressure are jointly in control in the production of injection-molded plastic parts.
If the data include correlated variables, then it is misleading to create separate control charts for each variable because the variables jointly affect the process. If you use separate univariate control charts in a multivariate situation, then the type I error and the probability of a point correctly falling within the control limits are not equal to their expected values. The distortion of these values increases with the number of measurement variables.
However, multivariate control charts are more difficult to interpret than classic Shewhart control charts. For example, the scale on multivariate control charts is unrelated to the scale of any of the variables. Also, out-of-control signals on multivariate control charts do not reveal which variable (or combination of variables) caused the signal.
Multivariate control charts in Minitab
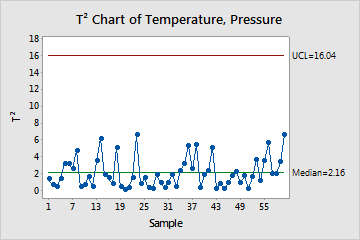
T2 chart
A chart of that uses a special statistic (Hotelling's T2) to monitor two or more correlated process characteristics at the same time.
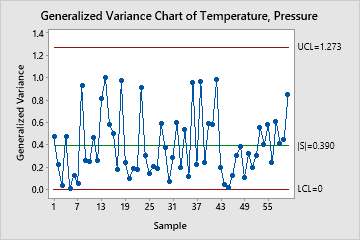
Generalized variance chart
A chart that monitors the process variability of two or more correlated process characteristics at the same time.
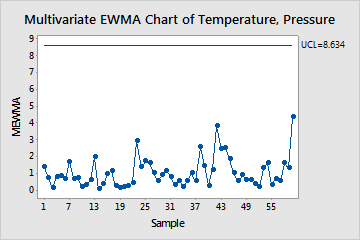
Multivariate EWMA chart
A multivariate control chart of exponentially weighted moving averages. Use to monitor two or more correlated process characteristics at the same time.
Note
Minitab also offers a combination chart, the T2 generalized variance control chart. Use this to view both the process mean and the process variation at the same time.
The T2 and generalized variance chart is the multivariate counterpart to the Xbar-R, Xbar-S, and I-MR charts.
The multivariate EWMA (MEWMA) chart is more sensitive to small shifts in the means of the variables than the T2 and generalized variance chart. However, to monitor the generalized variance you have to create a separate chart.