In This Topic
Examples of additional sigma limits
Use the Display additional σ limits at option on the Limits tab of the Options dialog box to add sigma limits to your control chart. Minitab draws additional limits at the standard deviation levels that you specify.
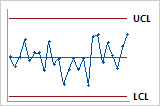
- No additional sigma limits
-
Usual control limits. No additional limits are drawn.
- Additional sigma limits at 1 and 2 standard deviations
-
Additional sigma limits can help you identify shifts and drifts or other patterns in the data.
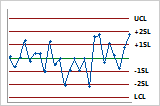
For example, to help you notice changes in the process sooner, you can display additional limits at ± 1 and ± 2 standard deviations. Values that you enter affect only the line position for display, not the test results.
Add sigma limit lines to your control chart
Use this procedure to add sigma limit lines to your control chart. This procedure demonstrates how to add lines at 1 and 2 standard deviations to an individuals chart. However, you can use the same basic procedure for other control charts and for other standard deviation values.
- Choose .
- Complete the dialog box as usual.
- Click I Chart Options and then click the Limits tab.
- In These multiples of the standard deviation, type 1 2 to add lines at 1 and 2 standard deviations.
- Click OK in each dialog box.
Add sigma limit lines of different colors
Suppose that you want to create an individuals chart with different color lines at 1 and 2 standard deviations, respectively.
- Choose .
- Complete the dialog box as usual.
- Click I Chart Options and then click the Limits tab.
- In These multiples of the standard deviation, type 1 2 to add lines at 1 and 2 standard deviations.
- Click OK in each dialog box.
- Choose .
- Choose .
-
Double-click the
IChartcommand in the History pane to select the command and all of the subcommands. - Click Copy to Command Line.
-
In the
Command
Line
pane, add the following 3 lines under the
IChartcommand:SLIMIT 2 1; CLIMIT; COLOR 25 74 44;The numbers you list after
COLORspecify colors from the outermost to the innermost limits. For information on color codes, go to Minitab Session Command Help. - Click Run.