A quality engineer for a wallpaper manufacturer wants to assess the stability of the printing process. Every hour, the engineer takes a sample of 100 feet of wallpaper and counts the number of printing defects, which include print smears, pattern distortions, and missing ink.
The engineer creates a C chart to monitor the number of defects.
- Open the sample data, WallpaperDefects.MWX.
- Choose .
- In Variables, enter Defects.
- Click C Chart Options.
- On the Tests tab, select 1 point > K standard deviations from center line (Test 1) and K points in a row on same side of center line (Test 2).If you are not sure which tests apply in your specific situation, use Tests 1 and 2 when you first establish the control limits based on your data.
- Click OK in each dialog box.
Interpret the results
The average number of defects per sample is 36.68. Samples 12 and 13 failed Test 1 because they are outside the control limits. Thus, the process is out of control. The engineer should identify and correct any factors that contribute to the special-cause variation.
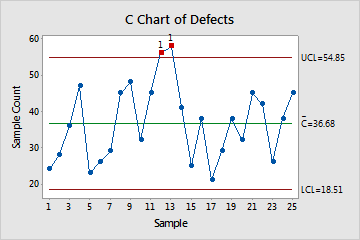
Test Results for C Chart of Defects
| TEST 1. One point more than 3.00 standard deviations from center line. |
|---|
| Test Failed at points: 12, 13 |