In This Topic
Mean
A commonly used measure of the center of a batch of numbers. The mean is also called the average. It is the sum of all observations divided by the number of (nonmissing) observations.
Formula

Notation
| Term | Description |
|---|---|
| xi | ith observation |
| N | number of nonmissing observations |
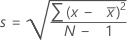
Standard deviation (StDev)
The sample standard deviation provides a measure of the spread of your data. It is equal to the square root of the sample variance.
Formula
 , then the standard deviation of the sample is:
Notation
| Term | Description |
|---|---|
| x i | i th observation |
 | mean of the observations |
| N | number of nonmissing observations |
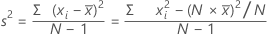
Variance
The variance measures how spread out the data are about their mean. The variance is equal to the standard deviation squared.
Formula
Notation
| Term | Description |
|---|---|
| xi | ith observation |
 | mean of the observations |
| N | number of nonmissing observations |
Sum
Formula

Notation
| Term | Description |
|---|---|
| xi | i th observation |
Minimum
The smallest value in your data set.
Median
The sample median is in the middle of the data: at least half the observations are less than or equal to it, and at least half are greater than or equal to it.
Suppose you have a column that contains N values. To calculate the median, first order your data values from smallest to largest. If N is odd, the sample median is the value in the middle. If N is even, the sample median is the average of the two middle values.
For example, when N = 5 and you have data x1, x2, x3, x4, and x5, the median = x3.
When N = 6 and you have ordered data x1, x2, x3, x4, x5,and x6:
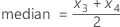
where x3 and x4 are the third and fourth observations.
Maximum
The largest value in your data set.
Proportion of the observed sample
Formula

Notation
| Term | Description |
|---|---|
| x | number of events in the original sample |
| N | number of trials in the original sample |
Average of the bootstrap sample
Formula

Note
To analyze a proportion, Minitab does not take resamples from the original column of data. Instead, Minitab takes the resamples by randomly sampling from a binomial distribution. The number of trials and the event probability for the distribution are taken from the original sample.
Notation
| Term | Description |
|---|---|
| ci | chosen statistic of the ith resample |
| B | number of resamples |
| N | number of observations in the original sample |
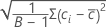
Standard deviation of the bootstrapping distribution
Formula
Notation
| Term | Description |
|---|---|
 | mean of the chosen statistic of the resamples |
| B | number of resamples |
| ci | chosen statistic of the ith resample |
Confidence interval for the chosen statistic
Formula
Sort the chosen statistic of the resamples in increasing order. x1 is the lowest number, xB is the highest number.
Lower bound: xl where = 
Upper bound: xu where = 
To analyze a proportion, Minitab does not take resamples from the original column of data. Instead, Minitab takes the resamples by randomly sampling from a binomial distribution. The number of trials and the event probability for the distribution are taken from the original sample.
Note
For a one-sided case (only a lower bound or upper bound), use α instead of α/2.
When l or u are not integers, Minitab does a linear interpolation between the two numbers on either side of l or u. The formula is:
Xy + z(Xy+1 - Xy)
For example, if l = 5.25, the lower bound equals x5 + 0.25(x6 - x5).
Minitab does not display the confidence interval when  or
or  .
.
Notation
| Term | Description |
|---|---|
| α | 1- confidence level/100 |
| B | number of resamples |
| Xy | the yth row of data when the data are sorted from least to greatest |
| y | the truncated value of l or u |
| z | l-y or u - y |