A quality engineer for a camera manufacturer wants to shorten the flash recovery time. Flash recovery time is the least amount of time that is required between flashes. The engineer wants to determine whether a relationship exists between the voltage that remains in the camera battery immediately after a flash and the flash recovery time. The engineer also wants to determine whether there are differences in flash recovery time between old and new formulations of the battery. The engineer collects random samples of batteries made with the old and new formulations. The engineer measures the volts remaining immediately after a flash and the flash recovery time for each.
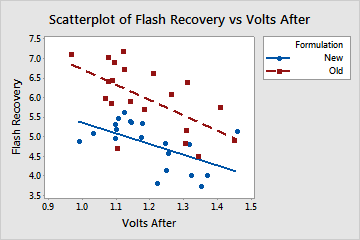
As part of the initial investigation, the engineer creates a scatterplot of volts remaining after a flash versus flash recovery time, grouped by battery formulation, to assess the relationship between the two variables for the two formulations.
- Open the sample data, FlashRecoveryTime.MWX.
- Choose .
- Under Y variables, enter Flash Recovery.
- Under X variables, enter Volts After.
- In Categorical variables for grouping (0-3), enter Formulation.
- Click OK.
Interpret the results
The scatterplot shows a negative linear relationship between the volts after and the flash recovery time. As the amount of volts after the flash increases, the recovery time decreases. The new formulation appears to require a shorter flash recovery time than the old formulation.