Use Line Plot to compare response patterns of a function or a series. You can create a line plot with symbols or without symbols, depending on the number of groups and length of series that you want to compare.
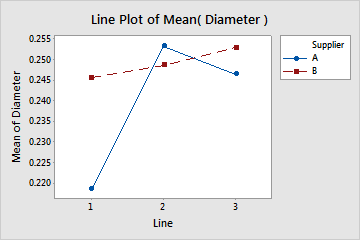
- Line plot of a function (with symbols)
- This type of line plot is an interaction plot that you can use to compare summary values for a two-way design. A line plot with symbols works best when you have only a few groups and short response patterns.
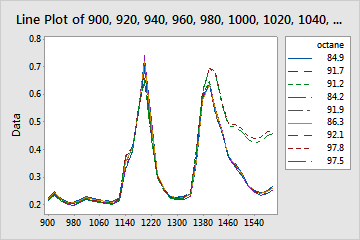
- Line plot of a series (without symbols)
- Use a line plot of a series without symbols to compare long response patterns for multiple groups, for example spectroscopy results. This type of line plot is similar to the calculated X plot in partial least squared regression.
Where to find this graph
To create a line plot, choose .