Step 1: Examine the calculated values
Using the values of the two power function variables that you entered, Minitab calculates the number of replicates, the value of the maximum difference between main effect means, or the power of the design.
- Values of the maximum difference between main effect means
- The maximum difference is the difference that you want to detect between the factor levels that have the highest and lowest means. The calculations use the factor that has the most levels to produce calculations that are conservative for other factors. Minitab calculates the smallest difference that the design detects. More replicates give the design the ability to detect smaller differences. Usually, you want to be able to detect the smallest difference that has practical consequences for your application.
- Replicates
- If you enter the value of the maximum difference between main effect means and the power value, Minitab calculates the number of replicates. Replicates are multiple experimental runs with the same factor settings. Because the number of replicates is an integer value, the actual power can be slightly greater than your target value.
- Total runs
- For every case, Minitab calculates the total runs from the number of replicates. The number of runs in a single replicate is the product of the numbers of levels. The total number of runs is the product of this base design size and the number of replicates.
- Power values
- If you enter the number of replicates and the maximum difference between main effect means, Minitab calculates the power value. Power is the probability that you will correctly find a significant difference. A power value of 0.9 is usually considered enough. A value of 0.9 indicates that you have a 90% chance of detecting the difference between the factor settings. With other design properties held constant, when the total number of runs is smaller or the maximum is smaller, the design has less power.
Results
| Maximum Difference | Reps | Total Runs | Target Power | Actual Power |
|---|---|---|---|---|
| 2.0 | 3 | 108 | 0.8 | 0.932615 |
| 2.0 | 3 | 108 | 0.9 | 0.932615 |
| 1.8 | 3 | 108 | 0.8 | 0.867493 |
| 1.8 | 4 | 144 | 0.9 | 0.952918 |
Key results: Maximum Difference, Reps, Total Runs, Target Power, Actual Power
In these results, Minitab calculates the number of replicates to reach a target power of 80% and a target power of 90%. To detect a difference of 2.0, the design requires 3 replicates to achieve either the target of 80% or the target of 90%. The power for the design with 2 replicates is less than the target power of 80%. To detect the smaller difference of 1.8, 3 replicates gives more than 80% power but not more than 90% power. To detect the smaller difference with 90% power, the designed experiment needs 4 replicates. Because the numbers of replicates are integers, the actual powers are greater than the target powers.
These results also show that the factor with the most levels has 4 levels. These results are accurate for the 4-level factor. The number of replicates could be different for the two 3-level factors, especially if the actual power is much greater than the target power.
Step 2: Examine the power curve
Use the power curve to assess the appropriate properties for your design.
The power curve represents the relationship between power and maximum difference for each number of replicates. Each symbol on the power curve represents a calculated value based on the properties that you enter. For example, if you enter a number of replicates and a power value, Minitab calculates the corresponding maximum difference and displays the calculated value on the graph.
Examine the values on the curve to determine the difference between the largest and smallest means for the factor with the most levels that the experiment detects at a certain power value and number of replicates. A power value of 0.9 is usually considered adequate. However, some practitioners consider a power value of 0.8 to be adequate. If a design has low power, you might fail to detect a difference that is practically significant. Increasing the total number of experimental runs increases the power of your design. You want enough experimental runs in your design to achieve adequate power. A design has more power to detect a larger difference than a smaller difference.
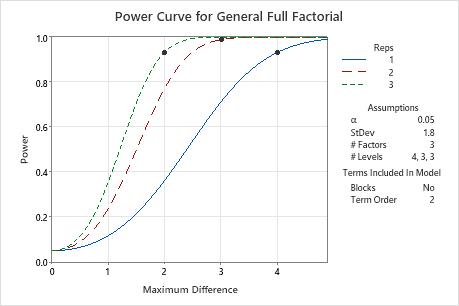
In these results, Minitab calculates the number of replicates to achieve a power of at least 0.9 for maximum differences of 2, 3 or 4. The plot has a curve for each number of replicates. To detect a maximum difference of 2 with a power of at least 0.9, the design needs 3 replicates. The plot contains a curve for 3 replicates and shows a symbol at a maximum difference of 2 where the power exceeds 0.9. To detect a maximum difference of 3 with at least 0.9 power, the design needs 2 replicates. For a maximum difference of 4 with at least 0.9 power, the design needs 1 replicate.