Engineers are developing a new ultrasonic cleaner. The engineers use a screening design to determine which potential factors affect the output power for the cleaner.
One of the engineers analyzes a definitive screening design to determine which of 7 factors have the greatest effect on the power output. Power output needs to be high enough to clean adequately. At the same time, power output needs to be low enough to clean without damaging the items.
- Open the sample data, ultrasonic_cleaner.MWX.
- Choose .
- In Responses, enter Power.
- Click Terms.
- In Include the following terms, choose Linear. Click OK.
- Click Graphs.
- Under Residual Plots, select Four in one.
- Check Residuals versus variables. Enter Quiet and Sweep.
- Click OK in each dialog box.
Interpret the results
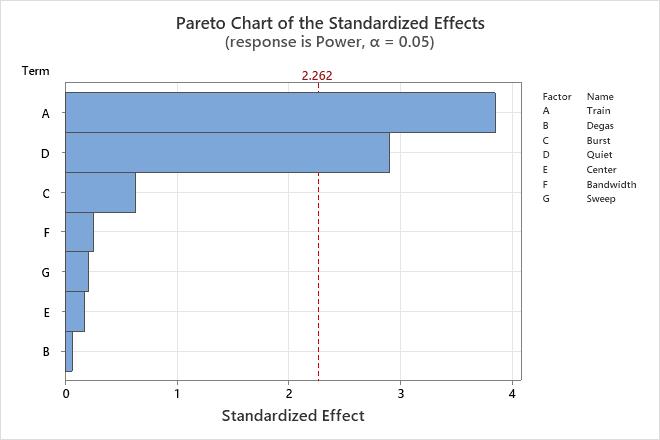
In the Pareto chart, the engineer sees that the largest main effects are for Train
(A) and Quiet (D). From the screening experiment, the engineer concludes that these
two factors deserve the most consideration for further analysis.
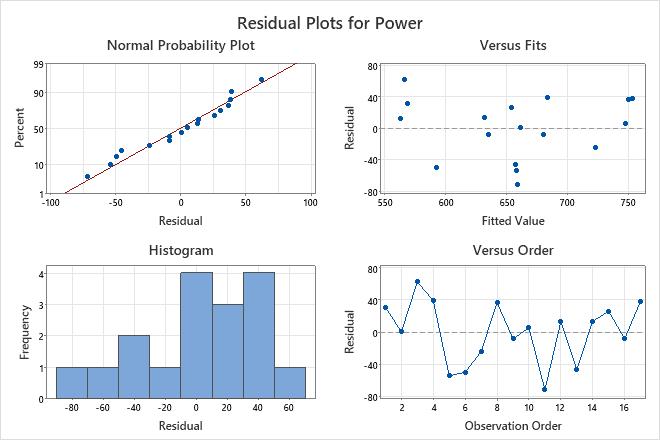
The residual versus fits plot shows a U-shaped curve. This pattern is an indication
that the model could be missing square terms or interactions. The plots of the
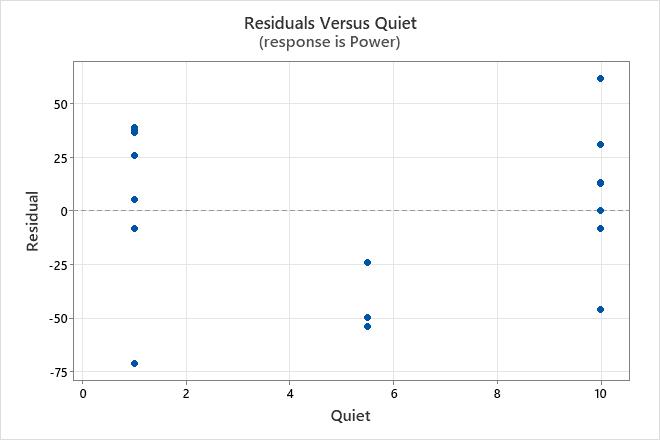
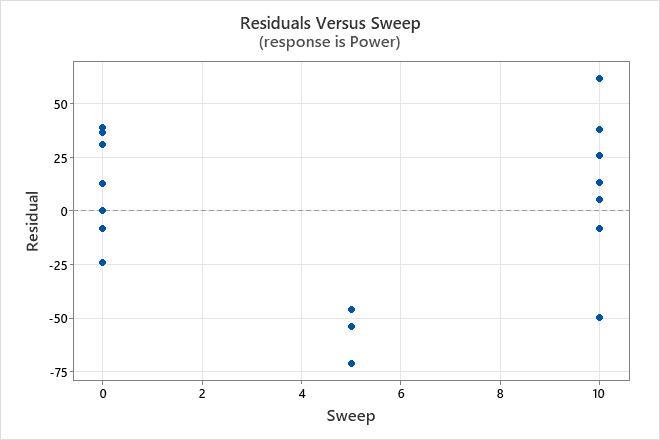
residuals against Quiet and Sweep show curves also. In the exploration of potential models, the engineer decides to
consider the square terms for these factors.
Coded Coefficients
| Constant | 657.8 | 12.4 | 53.22 | 0.000 | |
|---|
| Train | 52.4 | 13.6 | 3.85 | 0.004 | 1.00 |
|---|
| Degas | 0.9 | 13.6 | 0.07 | 0.949 | 1.00 |
|---|
| Burst | 8.6 | 13.6 | 0.63 | 0.542 | 1.00 |
|---|
| Quiet | -39.6 | 13.6 | -2.91 | 0.017 | 1.00 |
|---|
| Center | -2.4 | 13.6 | -0.17 | 0.866 | 1.00 |
|---|
| Bandwidth | 3.5 | 13.6 | 0.26 | 0.803 | 1.00 |
|---|
| Sweep | 2.8 | 13.6 | 0.21 | 0.839 | 1.00 |
|---|
Analysis of Variance
| Model | 7 | 61803.7 | 8829.1 | 3.40 | 0.046 |
|---|
| Linear | 7 | 61803.7 | 8829.1 | 3.40 | 0.046 |
|---|
| Train | 1 | 38451.1 | 38451.1 | 14.80 | 0.004 |
|---|
| Degas | 1 | 11.2 | 11.2 | 0.00 | 0.949 |
|---|
| Burst | 1 | 1040.6 | 1040.6 | 0.40 | 0.542 |
|---|
| Quiet | 1 | 21938.4 | 21938.4 | 8.45 | 0.017 |
|---|
| Center | 1 | 77.8 | 77.8 | 0.03 | 0.866 |
|---|
| Bandwidth | 1 | 171.5 | 171.5 | 0.07 | 0.803 |
|---|
| Sweep | 1 | 113.1 | 113.1 | 0.04 | 0.839 |
|---|
| Error | 9 | 23375.4 | 2597.3 | | |
|---|
| Total | 16 | 85179.2 | | | |
|---|
Regression Equation in Uncoded Units
| Power | = | 626.5 + 116.5 Train + 2.0 Degas + 1.92 Burst - 8.80 Quiet - 0.47 Center
+ 0.70 Bandwidth + 0.57 Sweep |
|---|
Alias Structure (up to order 2)
| A | Train |
|---|
| B | Degas |
|---|
| C | Burst |
|---|
| D | Quiet |
|---|
| E | Center |
|---|
| F | Bandwidth |
|---|
| G | Sweep |
|---|
| I + 0.82 AA + 0.82 BB + 0.82 CC + 0.82 DD + 0.82 EE + 0.82 FF + 0.82 GG |
|---|
| A |
|---|
| B |
|---|
| C |
|---|
| D |
|---|
| E |
|---|
| F |
|---|
| G |
|---|