Use a simplex design plot to visualize the mixture design space, or a portion of the design space if you have more than three components. Minitab plots the design points on triangular axes. For more information, go to What the triangular coordinate system shows.
- components only
- components and process variables
- components and an amount variable
The display depends on whether the design contains process variables or an amount variable, and how you choose to handle these variables. If your mixture design contains process variables or an amount variable, you can display a single plot or you can display all the levels of these variables. To see an example that displays multiple levels of a process variable, go to Example of Simplex Design Plot.
Tip
Hover the pointer over a design point to see the settings and the row number in the worksheet that are associated with that design point.
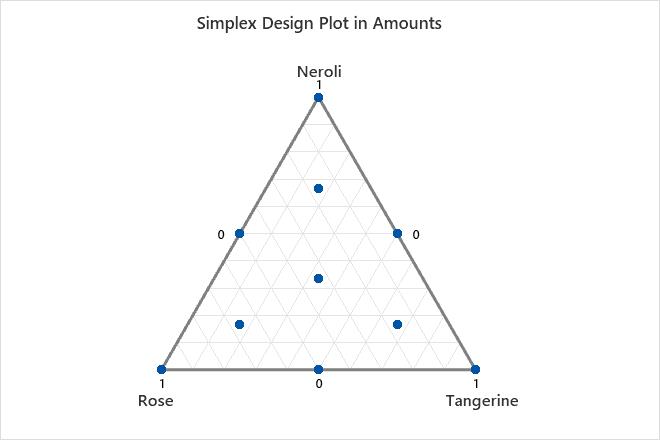
Key Results: Simplex Design Plot
- Three pure mixtures, one for each component (Neroli, Rose, and Tangerine). These points are found at the vertices of the triangle.
- Three binary blends, one for each possible two-component blend (Neroli-Rose, Rose-Tangerine, and Tangerine-Neroli). These design points are found at the midpoint of each edge of the triangle.
- Three complete blends. All three components are included in these blends, but not in equal proportions.
- One center point (or centroid). Equal proportions of all three components are included in this blend.