- Summary plot
- The summary plot includes the multiple comparison intervals for each group or factor level, the standard deviations, and the p-values for the tests.
- Individual value plot
-
Use an individual value plot to assess and compare sample data distributions. An individual value plot works best when the sample size is less than 50. Like a boxplot, an individual value plot helps you to identify potential outliers and see distribution shape. However, unlike a boxplot, an individual value plot displays each value separately. Separate values are especially useful when you have relatively few observations or when assessing the effect of each observation is important.

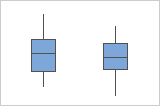
- Boxplot
-
Use a boxplot to assess and compare the shape, central tendency, and variability of sample distributions and to look for outliers. A boxplot works best when the sample size is at least 20. If the sample size is less than 20, consider using an individual value plot instead.