In This Topic
Shape
The shape parameter of a distribution determines the shape of distribution function. The shape is either estimated from the data or specified based on historical process knowledge.
Interpretation
The shape parameter for a given distribution can affect how symmetric or skewed the data are.
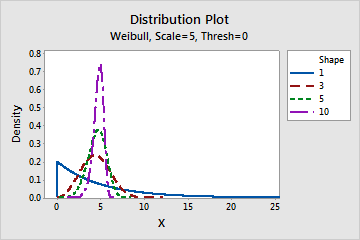
Effect of the shape parameter for a Weibull distribution
This graph shows the effect of the different values of the shape parameter on the Weibull distribution.
Scale
The scale parameter of a distribution determines the scale of the distribution function. The scale is either estimated from the data or specified based on historical process knowledge.
Interpretation
The scale parameter can affect how spread out the data are. Generally, a larger scale value can cause the distribution to appear more horizontally stretched out. A smaller scale value can cause the distribution to appear more horizontally compressed.
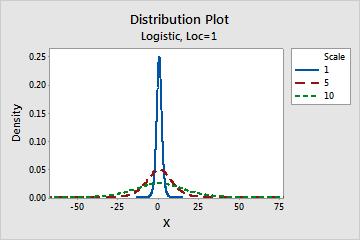
Effect of the scale parameter for a logistic distribution
This graph shows the effect of the different values of the scale parameter on the logistic distribution.
Location
The location parameter affects the location of a distribution. The location is either estimated from the data or specified based on historical process knowledge.
Interpretation
The location parameter can affect the location of the data by shifting it along the x-axis. A positive location value shifts a distribution to the right, while a negative location value shifts a distribution to the left.
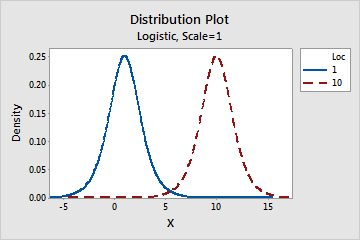
Effect of the location parameter for a logistic distribution
This graph shows the effect of the different values of the location parameter on the logistic distribution.
Threshold
The threshold parameter provides an estimate of the minimum value of a random variable. The threshold is either estimated from the data or specified based on historical process knowledge.
Interpretation
The threshold parameter defines the location of the minimum value that is theoretically possible for data from a distribution.
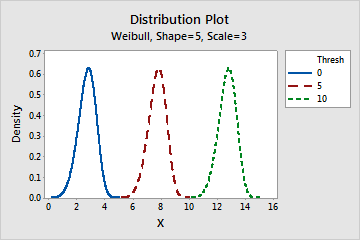
Effect of the threshold parameter for a Weibull distribution
This graph shows the effect of the different values of the threshold parameter on the Weibull distribution.
Pp
- The specification spread represented by Z-values. This interval represents the original specification limits from the selected nonnormal distribution in terms of Z-values on the standard normal distribution.
- 6-σ spread of the standard normal distribution. The 6-σ spread centered at process mean contains 99.74% of the process measurements when the measurements are normally distributed.
This definition of Pp is based on the Z-score calculation method (the default). For more information, go to Using the Z-score method to determine overall capability for nonnormal data.
Note
You must provide both a lower specification limit (LSL) and an upper specification limit (USL) to calculate the Pp index. If either the upper or lower specification limit is beyond the range of the distribution that you specified to model the data, Pp cannot be calculated using the default method. To change the calculation method, choose .
Interpretation
Use Pp to evaluate the overall capability of your process based on the process spread. Overall capability indicates the actual performance of your process that your customer experiences over time.
Generally, higher Pp values indicate a more capable process. Lower Pp values indicate that your process may need improvement. If Pp < 1, then the specification spread is less than the process spread, indicating that the process lacks the ability to produce at least 99.74 percent of conforming parts.
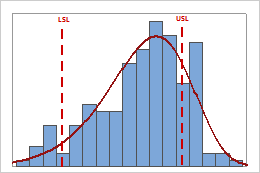
Low Pp
In this example, the specification spread is small relative to the process spread. Therefore, Pp is low (≈ 0.40), and the overall capability of the process is poor.
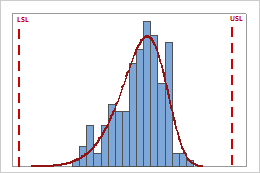
High Pp
In this example, the specification spread is large relative to the process spread. Therefore, Pp is high (≈ 1.80), and the overall capability of the process is good.
-
Compare Pp to a benchmark value to assess the overall capability of your process. Many industries use a benchmark value of 1.33. If Pp is lower than your benchmark, consider how to improve your process by reducing its variation.
-
Compare Pp and Ppk to assess whether the process median is close to the specification midpoint. If Pp > Ppk, the process median is off the specification midpoint and closer to one of the specification limits.
Ppk
- The one-sided specification spread, based on either the lower specification limit in the standard normal scale (Z.LSL) or the upper specification limit in the standard normal scale (Z.USL), whichever is smaller.
- One-half the 6-σ spread of the standard normal distribution, which equals 3.
This definition of Ppk is based on the Z-score calculation method (the default). For more information, go to Using the Z-score method to determine overall capability for nonnormal data.
Note
If the lower and upper specification limits are both beyond the range of the distribution that you specified to model the data, Ppk cannot be calculated using the default method. To change the calculation method, choose .
Interpretation
Use Ppk to evaluate the overall capability of your process based on both the process location and the process spread. Overall capability indicates the actual performance of your process that your customer experiences over time.
Generally, higher Ppk values indicate a more capable process. Lower Ppk values indicate that your process may need improvement.

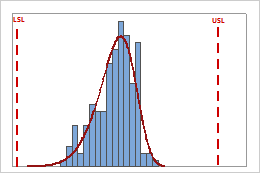
Low Ppk
In this example, the process is performing worse in relation to its upper specification limit than its lower specification limit. Therefore, the Ppk value equals PPU (≈ 0.40), which is low and indicates poor capability.
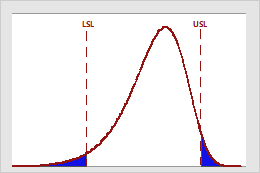
High Ppk
In this example, the process is performing worse in relation to its lower specification limit than its upper specification limit. Therefore, the Ppk value equals PPL (≈ 1.40), which is high and indicates good capability.
-
If Ppk < 1, then the specification spread is less than the process spread, indicating that more than 0.13 percent of the process output is outside at least one of the specification limits.
-
Compare Ppk to a benchmark value that represents the minimum value that is acceptable for your process. Many industries use a benchmark value of 1.33. If Ppk is lower than your benchmark, consider ways to improve your process.
CAUTION
The Ppk index represents the process capability for only the "worse" side of the process measurements, that is, the side that exhibits poorer process performance. If your process has nonconforming parts that fall on both sides of the specification limits, check the capability graphs and the probabilities of parts outside both specification limits to more fully assess process capability.
PPM Total for Expected Overall Performance
Interpretation
Use PPM Total for expected overall performance to estimate the number of nonconforming items, represented in parts per million, that you can expect to be outside the specification limits based on the overall variation of your process. Overall performance values indicate the actual process performance that your customer experiences over time.
Lower values of PPM Total indicate greater process capability. Ideally, few or no parts have measurements that are outside the specification limits.
| PPM | % Nonconforming Parts | % Conforming |
|---|---|---|
| 66807 | 6.6807% | 93.3193% |
| 6210 | 0.621% | 99.379% |
| 233 | 0.0233% | 99.9767% |
| 3.4 | 0.00034% | 99.99966% |
Z.Bench for Overall Capability
Z.Bench (overall) is a measure of the overall sigma capability for a process. The estimate for Z.Bench considers the probability of product that is below the lower LSL and above the USL. The estimate is based on the parameters of the nonnormal distribution that you specify for the analysis.
Note
To display Z.bench measures, you must click Options and change the default output from capability statistics to benchmark Z's when you perform the capability analysis.
Interpretation
Use Z.Bench (overall) to evaluate the overall sigma capability of your process.
Generally, higher Z.bench values indicate a more capable process. Lower Z.bench values indicate that your process may need improvement. When possible, compare Z.bench with a benchmark value based on process knowledge or industry standards. If Z.Bench is lower than your benchmark, consider ways to improve your process.